Viewing Computer Information
The Asset Management View
The view shows information on each computer, such as deployment status, active components on the computer, version installed on the computer and more.
|
|
Note - The General > Description at bottom pane shows the text entered in the Active Directory for the asset. If no text is entered, it is blank. |

From the View drop-down on the top left, select a preconfigured view:
-
Deployment
-
Compliance
-
Health
-
Full Disk Encryption
-
Anti-Malware
-
Host Isolation
-
Anti-Bot
-
Policy Information
-
Custom
Creating a Custom View
You can create a custom view with the filters and table column you specify.
To create a custom view:
-
Apply the filters and select the required columns for the table and click Update. For more information, see Table Filters and Column Description.
-
From the View drop-down, click Save View.
The Save New View window appears.
-
In the View name field, enter a name for the view. For example, Active Laptops.
-
In the Select what will be saved in this view section, select the required checkbox:
-
Filters
-
Table Columns
-
-
Click OK.
-
To delete a Custom View:
-
From the View drop-down, go to Custom Views.
-
Hover over the custom view and click
 .
.
-
Status Icon
The icon in the Status column shows the client or computer status.
|
Status Icon |
Description |
|---|---|
|
|
Indicates . |
|
|
Indicates Browser Security client. |
|
|
Indicates that the client connection is active. |
|
|
Indicates that a new computer was discovered that has no client installed. |
|
|
Indicates that the computer was deleted from the Active Directory or from the Organizational Tree. |


Filters
Use the Filters pane on the right side of the screen to filter the information in the table.
These are the main filters for this view:
-
Filter by computer property
-
Filter by Virtual Group
-
Filter by Organization Unit (this information is pulled from your Active Directory)
Use the Filters pane on the top of the screen to filter the information in the table.
To add filters:
-
In the Filters pane, click +.
-
Select the required filter or search for the filter using the Search bar. For information on the filters, see Table Filters and Column Description.
-
Click Update.
The system updates the table automatically for the added filters.
To modify the table:
-
Click
 on the top left header of the table.
 -
To select the columns for the table, search and select the columns.
-
To change the column position in the table, drag and drop the column to the required position.
-
Click Update.
Tip - The URL in the address bar of the web browser captures the filters you specify for the table. You can bookmark the URL to go to the Asset Management > Computers page and view the table with the specified filters.
|
Filter / Column Name |
Description |
||
|---|---|---|---|
|
Status |
Status of the connected computer. For more information, see Status Icon. |
||
|
Computer Name |
Name of the connected computer. |
||
|
Active |
Active computers. Computers that have communicated with in the last 30 days. |
||
|
Deleted |
Deleted computers. |
||
|
Domain Name |
Domain name of the connected computer. |
||
|
Agent Installed |
|||
|
Endpoint version |
|||
|
Operating System |
Version of the Operating System installed on the computer. |
||
|
Device Type |
Type of the computer (Desktop or Laptop). |
||
|
Compliance status of the computer. |
|||
|
Admin Comment |
Comment for the device. For example, This computer is used by Bob and Jane. |
||
|
Deployment Status |
Deployment status of the computer. |
||
|
Deploy Time |
Time when the client was installed on the computer. |
||
|
Inactive Capabilities |
Capabilities that are not active on the computer. Reasons can be any of these:
|
||
|
Deployment Error Code |
Error code of the failed deployment. |
||
|
Deployment Error Description |
Error description of the failed deployment. |
||
|
OS Build |
Operating System build number of the computer. |
||
|
Organizational Unit |
Active directory tree of your organization. |
||
|
FDE Status |
|||
|
FDE Version |
Full Disk Encryption engine version. |
||
|
Pre-boot |
Full Disk EncryptionPre-boot screen status of the computer. |
||
|
Pre-boot Status Updated On |
Full Disk EncryptionPre-boot screen status last update time. |
||
|
TPM Id |
Trusted Platform Module (TPM) Manufacturer ID of the computer. |
||
|
TPM Status |
TPM status of the computer. |
||
|
TPM Version |
TPM specification version implemented in the computer. |
||
|
Isolation Status |
Isolation status of the computer. |
||
|
Last Connection |
Last connection date of the computer. |
||
|
Endpoint CPU Tuning |
Recommended CPU tuning usage based on the Run Diagnostics Push Operation performed either manually or automatically every 4 hours.
Click the tuning recommendation level to view the diagnostics report. |
||
|
Synced On |
Sync date of the computer. |
||
|
Last Logged In User |
Last logged in user name on the computer. |
||
|
Virtual Groups |
Pre-defined and custom virtual groups of the computer. |
||
|
Enforced & Installed Policy Name |
Enforced and installed policy name. |
||
|
Enforced & Installed Policy Version |
Enforced and installed policy version. |
||
|
Threat Emulation availability status. |
|||
|
Threat Emulation Reputation Status |
Threat Emulation reputation status. |
||
|
Browser Status |
Shows the browser and the Browser Security extension status on the endpoint. The supported statuses are:
|
 indicates that the Edge browser is active and the extension on it was detected.
 indicates that the Brave browser is active but the extension is not detected. Contact
 Working with the Computers Table
-
Hover over the column and click
 .
. -
From the drop-down :
-
To adjust the column position in the table, drag and drop the column to the required position.
-
To copy the value of a cell to the clipboard, hover over a cell and click Copy.
-
To copy the values of a row to the clipboard, hover over a row and click Copy row.
Managing Computers
Select the checkbox to the left of the applicable computers and right-click to perform these actions:
General Actions
You can view logs of computers based on it's IP address.
To view computer logs by it's IP address:
-
Go to Asset Management > Computers.
-
Select the applicable computer or user from the list.
-
From the top toolbar, click
 .
. -
Select General Actions > View Computer Logs.
The system opens the Logs menu and shows the computer logs.
You can create a virtual group. See Managing Virtual Groups.
You can add computers to a new virtual group. See Managing Virtual Groups.
You can add a computer to a virtual group (see Managing Virtual Groups).
When the Endpoint client is installed on a computer, information about the computer is sent to and stored on the Endpoint Security Management Server![]() A Security Management Server that manages your Endpoint Security environment. Includes the Endpoint Security policy management and databases. It communicates with endpoint clients to update their components, policies, and protection data..
A Security Management Server that manages your Endpoint Security environment. Includes the Endpoint Security policy management and databases. It communicates with endpoint clients to update their components, policies, and protection data..
Resetting a computer means deleting all information about it from the server.
Resetting a computer does not remove the object from the Active Directory tree or change its position in the tree.
|
|
Important - You can only reset a computer if the Endpoint client is not installed. If you reset a computer that has Endpoint installed, important data is deleted and the computer can have problems communicating with the Endpoint Security Management Server |

Computer reset:
-
Removes all licenses from the computer.
-
Deletes Full Disk Encryption Recovery data.
-
Deletes the settings of users that can log on to it.
-
Removes the computer from Endpoint Security Monitoring.
-
Deletes the Pre-boot settings.
-
Marks the computer as unregistered.
After you reset a computer, you must reformat it before it can connect again to the Endpoint Security service.
You may decide to reset a computer if:
-
The Endpoint client was uninstalled or the computer is re-imaged.
-
It is necessary to reset the computer's configuration before a new Endpoint client is installed. For example, if the computer is transferred to a different person.
Removes the asset from the Local or Active Directory and adds it to Deleted Entities in the Organizational Tree. This operation discards the assets license information. You can use this operation when you remove an asset from your domain.
Note - If the Endpoint Security client is still installed on the asset, the client continues to receive the updates from the Endpoint Security Management Server![]() Check Point Single-Domain Security Management Server or a Multi-Domain Security Management Server..
Check Point Single-Domain Security Management Server or a Multi-Domain Security Management Server..
To add the asset back to the Active Directory, see Recover.
Adds the deleted asset back to the Local or Active Directory from Deleted Entities in the Organizational Tree. The asset's status is not Active until its Endpoint Security client connects and synchronizes with the Endpoint Security Management Server. You can use this operation when you add an asset back to the domain.
Note - You can recover only a deleted asset.
Warning - Removes the asset from the Endpoint Security management permanently. You cannot recover a terminated asset. We recommend to terminate an asset only if it is discarded or disposed or the Endpoint Security client is uninstalled.
Endpoint Security can scan and import users, groups, Organizational units (OUs) and computers from multiple supported directory domains. See Managing Active Directory Scanners.
The Overview View
The Overview page shows a graphical summary of important information about the clients in your organization.
Operational Overview
The information in the Operational Overview appears in widgets described below. Each widget is clickable, and takes you to the relevant view based on the
The information is presented in these widgets:
|
Widget |
Description |
|---|---|
| All Endpoints |
Shows the number of protected endpoints and the number of endpoints which report issues. This widget is based on the Health view. |
| Desktops |
Shows a division of the desktops by operating systems: Windows, macOS, and Linux. This widget is based on the Health view. This widget only includes protected entities. |
|
Laptops |
Shows a division of the laptops by operating systems: Windows, macOS, and Linux. This widget is based on the Health view. This widget only includes protected entities. |
|
Deployment Status |
Shows the deployment status of the devices according to these values:
|
|
Health Status |
Shows which computers have installed components that are not running. |
|
Anti-Malware Update |
Shows the time when updates were installed on the endpoint clients:
This widget is based on the Anti-Malware update ON data in the Deployment Status. |
|
Endpoint Security Version |
Shows the client versions installed on the endpoint clients. This widget is based on the Deployment view. |
|
Operating System |
Shows the type of operating system installed on the endpoint clients:
|
In addition, in the top right section Active Alerts you can see alerts for the thresholds you created in the Endpoint Settings view > Alerts (see Monitoring Endpoint Security Deployment and Policy).
Reports
On the Reports page, you can download the reports in the pdf format:
-
Threat Extraction Report - Shows the insights on the downloaded files.
-
Check Point Cyber Security Report - Shows the latest security trends as per Check Point.
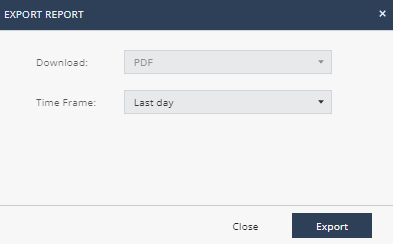
Generate Report
To generate a report:
-
Go to Overview > Reports > Generate Report.
-
Select a report, click
 and select Export Report.
The Export Report window appears.
-
In the Time Frame list, select Last day, Last 7 days, or Last 30 days.
-
Click Export.
Scheduled Reports
Scheduled Reports allows you to automatically generate reports at the specified date and time, and email it to the specified recipients.
|
|
Notes:
|
To schedule a report:
-
Navigate to Overview> Reports and do one of these:
-
From the Scheduled Reports page, click Add and from the Name list, select the report.
-
From the Generate Report page, select the report, click
and select Schedule Report.
-
-
From the Name list, select the report.
-
From the Time Frame list, select the period for the report:
-
Last day
-
Last 7 days
-
Last 30 days
-
-
From the Frequency list, select the frequency to generate the report:
-
To generate the report everyday, select the day of the week.
-
To generate the report weekly, select the day of the week.
-
To generate the report every month, select the date.
-
-
In the Time field, specify the time for the system to generate the report and send it to the recipients. By default, the time is in UTC. For example, if you want to generate the report at 01.00 AM Eastern Standard Time (EST), you must specify the time as 06.00 AM UTC.
-
In the Recipients field, enter the recipients for the report.
-
Click Schedule.
The schedule is added to the table. The report becomes effective 24 hours after you schedule it.
-
To edit a scheduled report, select the report in the table and click Edit.
-
To delete a scheduled report, select the report in the table and click Delete.
Announcements
The Announcements page shows the latest news and enhancements in .