Monitoring Threat Prevention
Log Sessions
Gateway traffic generates a large amount of activity. To make sure that the amount of logs is manageable, by default, logs are consolidated by session. A session is a period that starts when a user first accesses an application or site. During a session, the gateway records one log for each application or site that a user accesses. All activity that the user does within the session is included in the log.
To see the number of connections made during a session, see the Suppressed Logs field of the log in the Logs & Monitor view.
Session duration for all connections that are prevented or detected in the Rule Base![]() All rules configured in a given Security Policy. Synonym: Rulebase. is, by default, 10 hours. You can change this in the Manage & Settings view in SmartConsole
All rules configured in a given Security Policy. Synonym: Rulebase. is, by default, 10 hours. You can change this in the Manage & Settings view in SmartConsole![]() Check Point GUI application used to manage a Check Point environment - configure Security Policies, configure devices, monitor products and events, install updates, and so on. > Blades > Threat Prevention > Advanced Settings > General > Connection Unification.
Check Point GUI application used to manage a Check Point environment - configure Security Policies, configure devices, monitor products and events, install updates, and so on. > Blades > Threat Prevention > Advanced Settings > General > Connection Unification.
Using the Log View
|
Step |
Instructions |
|---|---|
|
1 |
Go to Logs and Monitoring > View. |
|
2 |
Click New, and then select New View. |
|
3 |
In the New View window, enter:
|
|
4 |
In the new window that opens, create a query. Click Options > View Filter and select Blade and App control. |
|
5 |
To customize how you see the data that comes back from the query, click Add Widget. Start with a Timeline of all events. In Table, you can create a table that contains multiple field such as user, application name, and the amount of traffic. Additional widgets for use: map, infographic, rich text, chart, and container (for multiple widgets). After you save the changes in SmartConsole, you can schedule and get an automatic email at multiple intervals. |
|
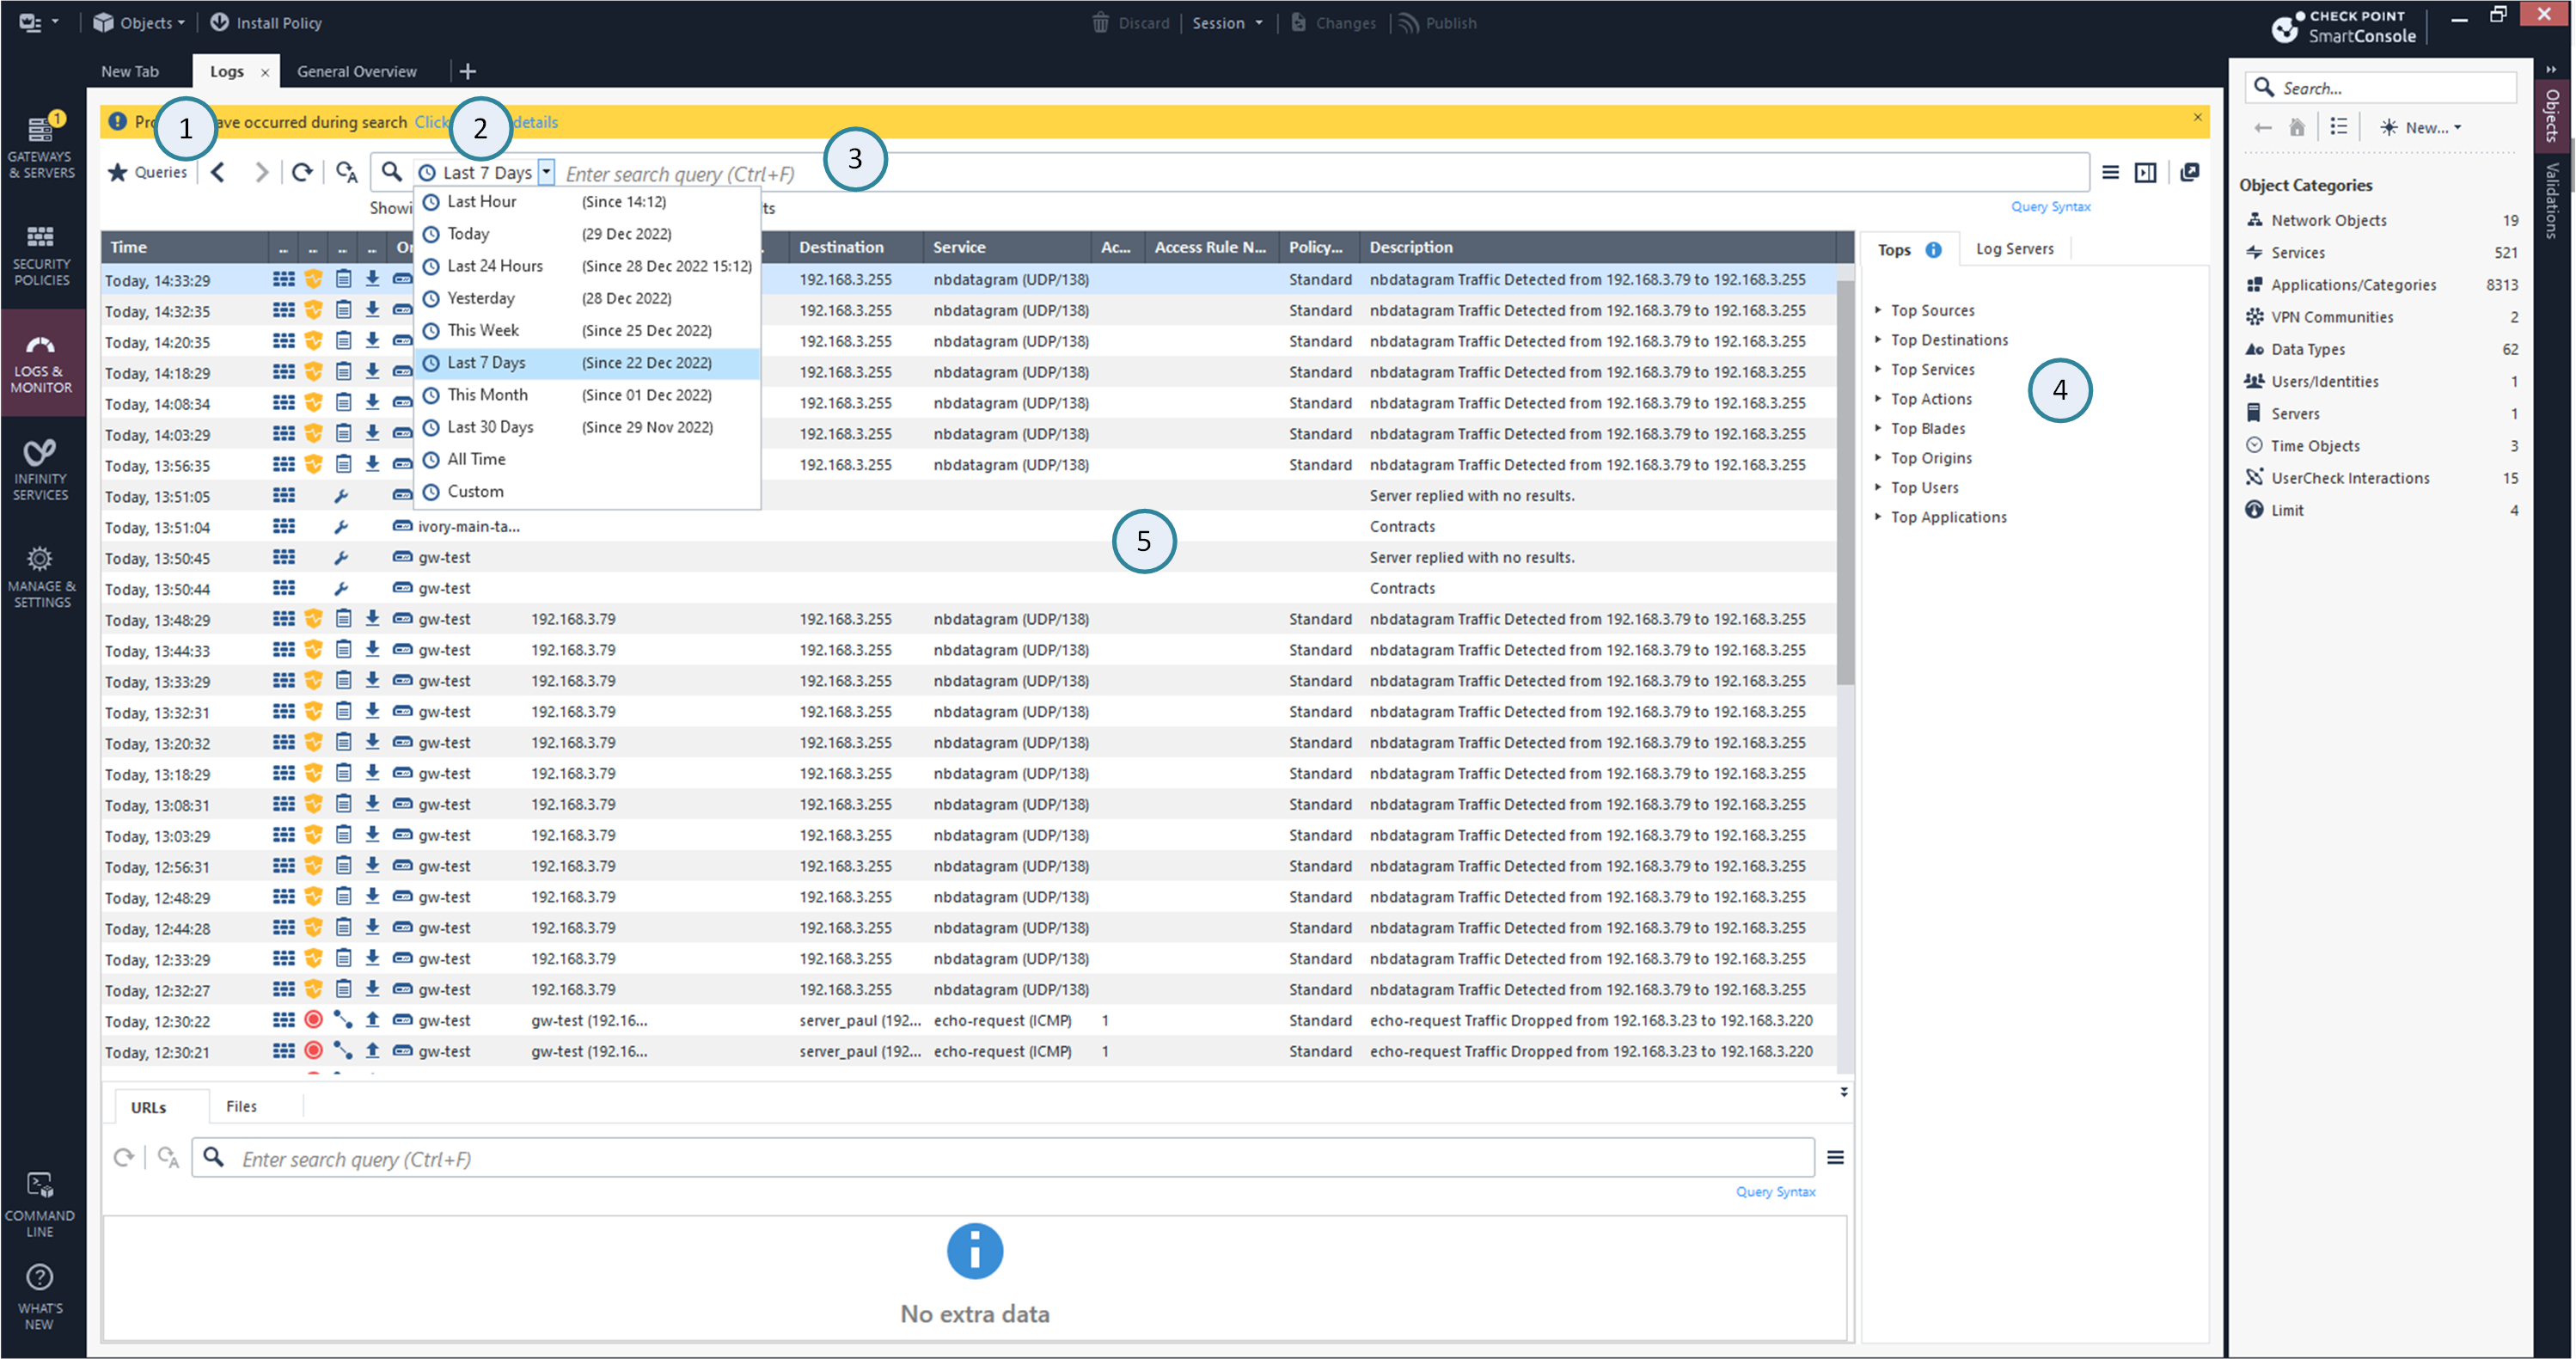
Item |
Description |
|---|---|
|
1 |
Queries - Predefined and favorite search queries. |
|
2 |
Time Period - Search with predefined custom time periods. |
|
3 |
Query search bar - Define custom queries in this field. You can use the GUI tools or manually enter query criteria. Shows the query definition for the most recent query. |
|
4 |
Log statistics pane - Shows top results of the most recent query. |
|
5 |
Results pane - Shows log entries for the most recent query. |
Viewing Threat Prevention Rule Logs
|
Step |
Instructions |
|---|---|
|
1 |
In SmartConsole, go to the Security Policies view. |
|
2 |
In the Threat Prevention Policy, select a rule |
|
3 |
In the bottom pane, click one of these tabs to see:
|
Predefined Queries
The Logs & Monitor Logs tab provide a set of predefined queries, which are appropriate for many scenarios.
Queries are organized by combinations of event properties.
-
Threat Prevention > by Blades.
-
More > such as by UA Server or UA WebAccess.
-
Anti-Spam & Email Security Blade > such as by Blocklist Anti-Spam, or IP Reputation Anti-Spam.
Creating Custom Queries
Queries can include one or more criteria. You can modify an existing predefined query or create a new one in the query box.
To modify a predefined query:
Click inside the query box to add search filters.
|
Step |
Instructions |
|---|---|
|
1 |
Click Queries > Add to Favorites. The Add to Favorites window opens. |
|
2 |
Enter a name for the query. |
|
3 |
Select or create a new folder to store the query. |
|
4 |
Click Add. |
Selecting Criteria from Grid Columns
You can use the column headings in the Grid view to select query criteria. This option is not available in the Table view.
|
Step |
Instructions |
|---|---|
|
1 |
In the Results pane, right-click on a column heading. |
|
2 |
Select Add Filter. |
|
3 |
Select or enter the filter criteria. |
To enter more criteria, use this procedure or other procedures.
Manually Entering Query Criteria
You can enter query criteria directly in the Query search bar. You can manually create a new query or make changes to an existing query that shows in the Query search bar.
As you enter text, the Search shows recently used query criteria or full queries. To use these search suggestions, select them from the drop-down list.
Selecting Query Fields
You can enter query criteria directly from the Query search bar.
|
Step |
Instructions |
|---|---|
|
1 |
If you start a new query, click Clear |
|
2 |
Put the cursor in the Query search bar. |
|
3 |
Select a criterion from the drop-down list, or enter the criteria in the Query search bar. |
 to remove query definitions.
Packet Capture
You can capture network traffic. The content of the packet capture provides a greater insight into the traffic which generated the log. With this feature activated, the Security Gateway![]() Dedicated Check Point server that runs Check Point software to inspect traffic and enforce Security Policies for connected network resources. sends a packet capture file with the log to the Log Server
Dedicated Check Point server that runs Check Point software to inspect traffic and enforce Security Policies for connected network resources. sends a packet capture file with the log to the Log Server![]() Dedicated Check Point server that runs Check Point software to store and process logs.. You can open the file, or save it to a file location to retrieve the information a later time.
Dedicated Check Point server that runs Check Point software to store and process logs.. You can open the file, or save it to a file location to retrieve the information a later time.
For some blades, the packet capture option is activated by default in Threat Prevention Policy.
|
Step |
Instructions |
|---|---|
|
1 |
In SmartConsole > Security Policies view > Threat Prevention > Custom Policy. |
|
2 |
Select the required rule. |
|
|
Right-click the Track column of the rule, and clear Packet Capture. |
|
Step |
Instructions |
|---|---|
|
1 |
In SmartConsole, go to the Logs & Monitor view. |
|
2 |
Open the log. |
|
3 |
Click the link in the Packet Capture field. The Packet Capture opens in a program associated with the file type. |
|
4 |
Click Save to save the packet capture data on your computer. |
Advanced Forensics Details
From R80.30, some logs contain additional fields which can be found in the Advanced Forensics Details section in the log. These protocols are supported: DNS, FTP, SMTP, HTTP, and HTTPS. The additional information is used by the Check Point researchers to analyze attacks. The advanced forensics details also show in the gateway statistics files which are sent to the Check Point cloud.
|
Step |
Instructions |
|---|---|
|
1 |
In SmartConsole >, go to Security Policies > Threat Prevention > Custom Policy. |
|
2 |
Go to the required rule and select the Track column. |
|
3 |
From the drop-down menu, select Forensics. |
The Advanced Forensics Details do not show if the connection closes before this information is saved. This depends on the traffic and configuration of the Software Blades.
-
When the gateway finds the connection is malicious before the additional details are saved.
-
When Threat Emulation
 Check Point Software Blade on a Security Gateway that monitors the behavior of files in a sandbox to determine whether or not they are malicious. Acronym: TE. or Anti-Virus Check Point Software Blade on a Security Gateway that uses real-time virus signatures and anomaly-based protections from ThreatCloud to detect and block malware at the Security Gateway before users are affected. Acronym: AV. are in Rapid Delivery mode, and file is downloaded and the connection closes before the examination of the file is complete. In such case, the Forensics details may not show.
Threat Analysis in the Logs & Monitor View
The Logs & Monitor view supplies advanced analysis tools with filtering, charts, reporting, statistics, and more, of all events that travel through enabled Security Gateways.
You can filter the Threat Prevention Software Blade![]() Specific security solution (module): (1) On a Security Gateway, each Software Blade inspects specific characteristics of the traffic (2) On a Management Server, each Software Blade enables different management capabilities. information for fast monitoring and useful reporting on connection incidents related to them.
Specific security solution (module): (1) On a Security Gateway, each Software Blade inspects specific characteristics of the traffic (2) On a Management Server, each Software Blade enables different management capabilities. information for fast monitoring and useful reporting on connection incidents related to them.
-
Real-time and historical graphs and reports of threat incidents
-
Graphical incident timelines for fast data retrieval
-
Easily configured custom views to quickly view specified queries
-
Incident management workflow
-
Reports to data owners on a scheduled basis
Views
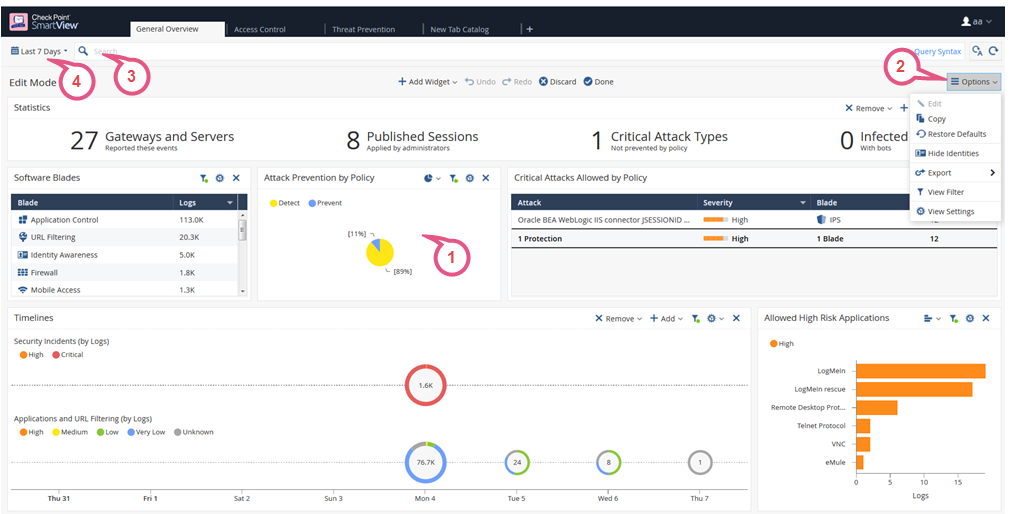
Views window tells administrators and other stakeholders about security and network events. A View window is an interactive dashboard made up of widgets. Each widget is the output of a query. A Widget pane can show information in different formats, for example, a chart or a table.
SmartConsole comes with several predefined views. You can create new views that match your needs, or you can customize an existing view. Views are accurate to the time they were generated or refreshed.
In the Logs & Monitor view, clicking the (+) tab opens a catalog of all views and reports, predefined and customized. To open a view, double-click the view or select the applicable view and click Open from the action bar.
|
Item |
Description |
|---|---|
|
1 |
Widget - The output of a query. A Widget can show information in different formats, for example, a chart or a table. To find out more about the events, you can double-click most widgets to drill down to a more specific view or raw log files. |
|
2 |
Options - Customize the view, restore defaults, Hide Identities, export. |
|
3 |
Query search bar - Define custom queries using the GUI tools, or manually entering query criteria. Shows the query definition for the most recent query. |
|
4 |
Time Period - Specify the time periods for the view. |
For more information on using and customizing reports, see the R81.10 Logging and Monitoring Administration Guide.
Reports
A report consists of multiple views and a cover page. There are several predefined reports, and you can create new reports. A report gives more details than a view. Reports can be customized, filtered, generated and scheduled. You cannot drill down into a report.
Click the (+) tab to open a catalog of all views and reports, predefined and customized. To open a report, double-click the report or select the applicable report and click Open.
For more information on using and customizing reports, see the R81.10 Logging and Monitoring Administration Guide