Using the Logs View
In SmartConsole:
-
Go to Logs and Monitoring > View.
-
Click New, and select New View.
-
In the New View window, enter:
-
Name
-
Category - For example, select Access Control
-
Description (optional)
-
-
In the new window that opens, create a query. Click Options > View Filter and select blade and app control.
-
Click Add Widget to customize how you see the data that comes back from the query.
Start with a Timeline of all events.
In Table, you can create a table that contains multiple fields such as user, application name, and the amount of traffic. There are more widgets you can use: map, infographic, rich text, chart, and container (for multiple widgets).
After you save the dashboard (done), you can schedule and get an automatic email at multiple intervals.
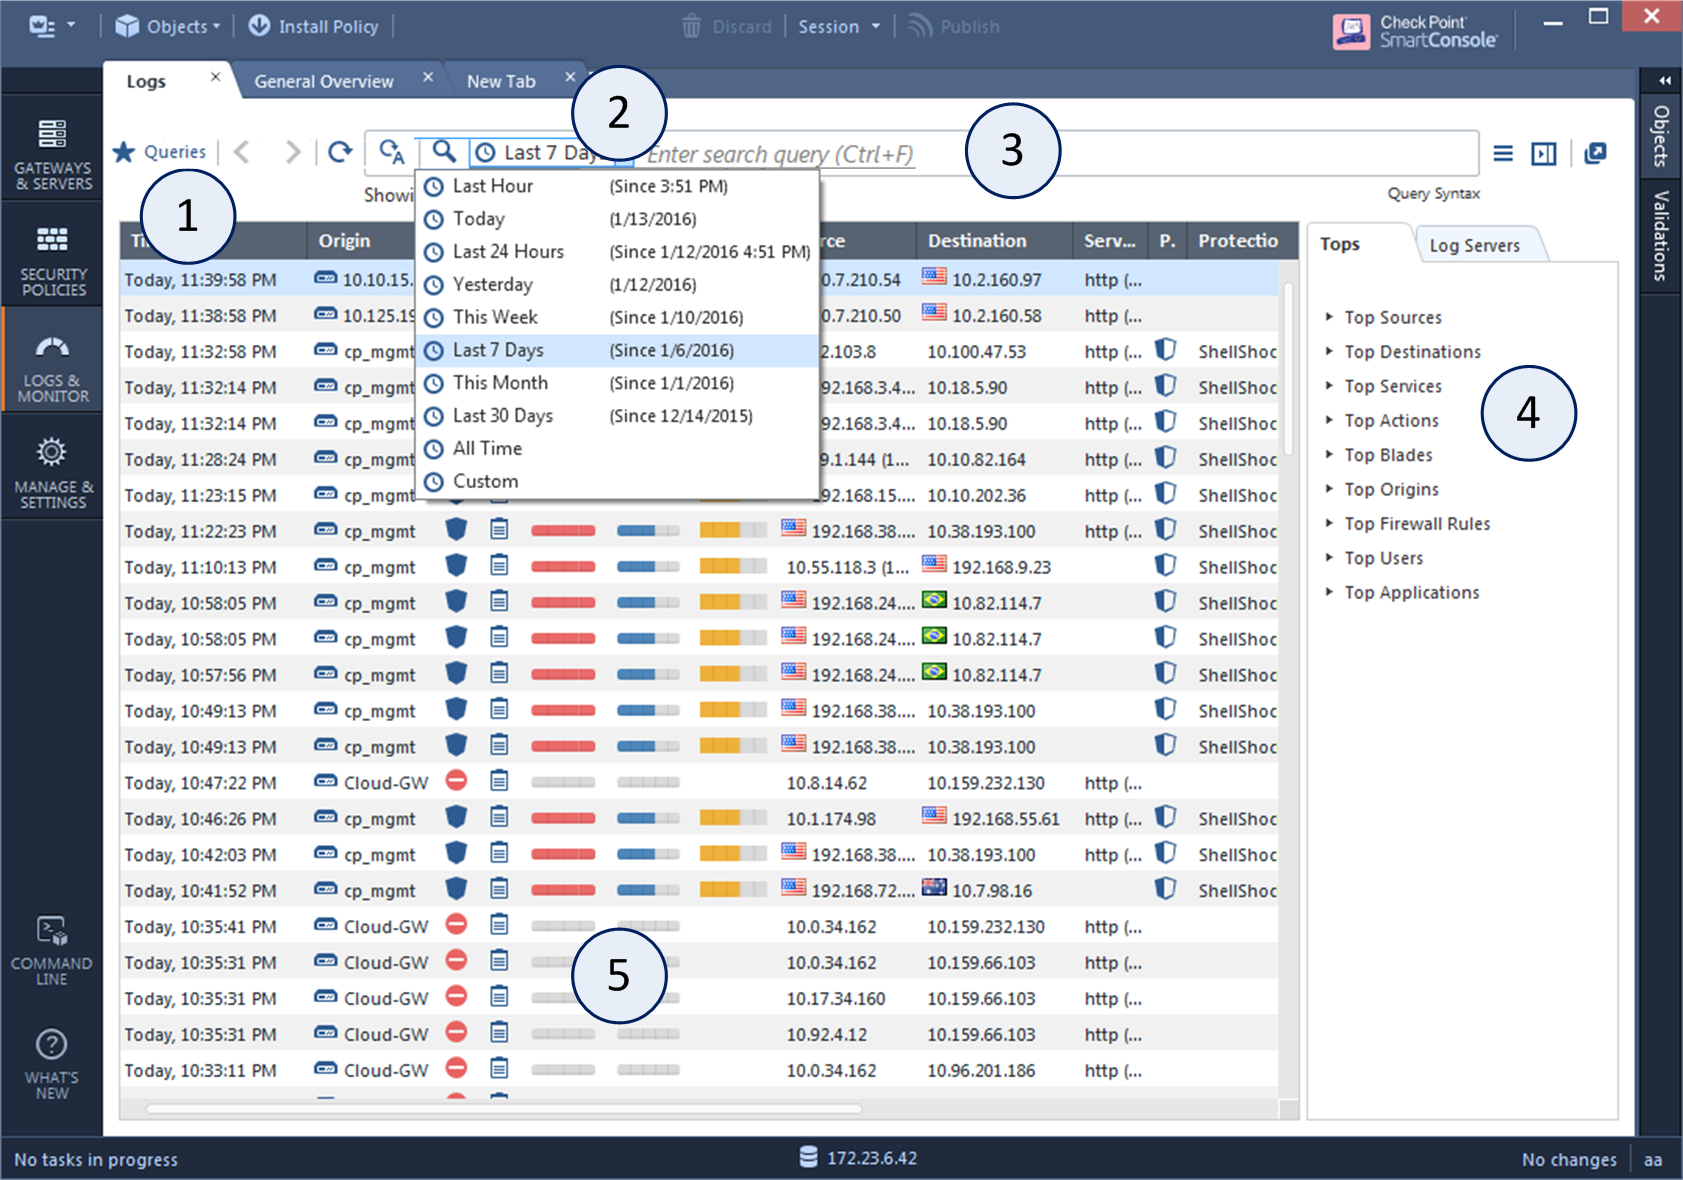
This is an example of the Logs view.
|
Item |
Description |
|---|---|
|
1 |
Queries - Predefined and favorite search queries. |
|
2 |
Time Period - Search with predefined custom time periods. |
|
3 |
Query search bar - Define custom queries in this field. You can use the GUI tools or manually enter query criteria. Shows the query definition for the most recent query. |
|
4 |
Log statistics pane - Shows top results of the most recent query. |
|
5 |
Results pane - Shows log entries for the most recent query. |
|
|
Note - On a Security Management Server |
