


|
|
|
You can capture network traffic. The content of the packet capture provides a greater insight into the traffic which generated the log. With this feature activated, the Security Gateway sends a packet capture file with the log to the log server. You can open the file, or save it to a file location to retrieve the information a later time.
For some blades, the packet capture option is activated by default in Threat Policy.
To deactivate packet capture (in Threat Policy only):
To see a packet capture:
The Packet Capture opens in a program associated with the file type.
From R80.30, some logs contain additional fields which can be found in the Advanced Forensics Details section in the log. These protocols are supported: DNS, FTP, SMTP, HTTP, and HTTPS. The additional information is used by the Check Point researchers to analyze attacks. The advanced forensics details also show in the gateway statistics files which are sent to the Check Point Cloud.
To enable the Advanced Forensics Details feature:
In SmartConsole, go to >, Go to Security Policies > Threat Prevention > Policy > Track > from the drop-down menu, select Forensics.
The Advanced Forensics Details do not show if the connection closes before this information is saved. This depends on the traffic and configuration of the Software Blades. For example:
The Logs & Monitor view supplies advanced analysis tools with filtering, charts, reporting, statistics, and more, of all events that travel through enabled Security Gateways.
You can filter the Threat Prevention Software Blade information for fast monitoring and useful reporting on connection incidents related to them.
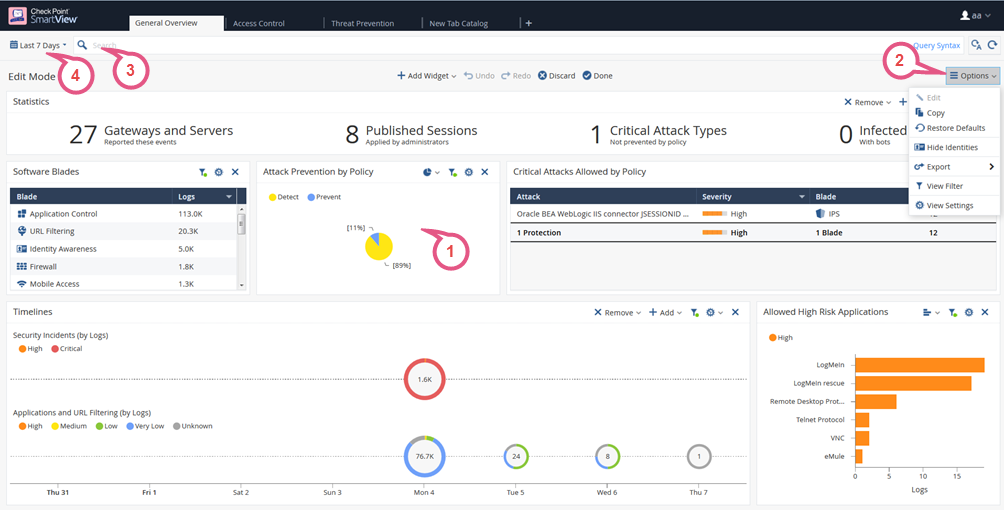
Views window tells administrators and other stakeholders about security and network events. A View window is an interactive dashboard made up of widgets. Each widget is the output of a query. A Widget pane can show information in different formats, for example, a chart or a table.
SmartConsole comes with several predefined views. You can create new views that match your needs, or you can customize an existing view. Views are accurate to the time they were generated or refreshed.
In the Logs & Monitor view, clicking the (+) tab opens a catalog of all views and reports, predefined and customized. To open a view, double-click the view or select the desired view and click Open from the action bar.
Item |
Description |
|---|---|
1 |
Widget- The output of a query. A Widget can show information in different formats, for example, a chart or a table. To find out more about the events, you can double-click most widgets to drill down to a more specific view or raw log files. |
2 |
Options - Customize the view, restore defaults, Hide Identities, export. |
3 |
Query search bar - Define custom queries using the GUI tools, or manually entering query criteria. Shows the query definition for the most recent query. |
4 |
Time Period - Specify the time periods for the view. |
For more information on using and customizing reports, see the R80.30 Logging and Monitoring Administration Guide.

