Introduction
The purpose of this guide is to assist you in making decisions regarding the performance of the R80.10 version of:
- Security Management Servers
- Log Management Servers
In this guide, we explain how to select the correct hardware for an optimal experience. We provide tips on tuning your environment for performance-intensive operations. Finally, we help you troubleshoot performance-related problems in case they happen. Performance-related problems include:
- Interaction with the Security Management Server or the Log Server
- Policy installation process
- Working with the SmartConsole GUI application
Comparing R80.10 hardware requirements to earlier versions
R80.10 Security Management is designed to solve the most complex security operational challenges with intuitive user interfaces and API's.
Our focus is to help our users:
- Avoid mistakes
- Maintain a revision history for every element
- Find anything in a matter of seconds
- Support concurrent team work
- Have consistent data that is up-to-date across the board.
The R80.10 Security Management architecture contains:
- Log and management configuration indexing enabled by default for fast log queries and security management search. We changed our logging and search backend to more capable architectures that can support fast reliable retrieval.
- Note: Check Point's low-end devices such as 205 and 210, do not enable log indexing by default, for performance reasons.
- Fully-synchronized log indexes to guarantee the up-to-date data at the log server. In previous releases we had a "tracker" for storage and an "indexer" for efficient search. With R80.10, everything is indexed by default.
- Built-in validations that block misconfigurations before they are published
- Automatic revisions that occupy significantly smaller disk space.
- A granular per-object lock mechanism to allow concurrent administrator work.
All of these are essential features for our users. It is critical to protecting and validate your data, especially with automated security operations.
When you offload a lot of the processing power to your Security Management Server and the Log Management Server, it is even more important to have the correct hardware to suit your needs.
In this guide, we help you determine your hardware and software requirements so you can make informed decisions about management solutions for a Security Management Server and a Log Management Server. We then discuss software-based performance tuning and suggestions for extending your hardware or your software to match your business requirements.
We cannot stress enough how measuring your security needs pre-deployment impacts your user experience. If you are about to use Check Point R80.10 Security Management, make sure that you get the correct hardware to your needs.
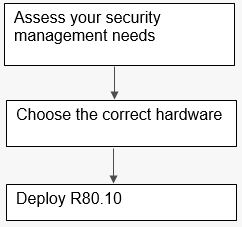
Figure 1: Assess your needs and choose the correct hardware prior to deployment of R80.10.
Assessing
Before you begin, please prepare answers on how you will use your Security Management Server:
- How many gateways will your Security Management Server manage?
- Will you utilize a Multi-Domain Management? If so, how many domains?
Important measurements for how you will use your Log Management Server:
- CPS (connections per seconds) that will be handled by each security gateway.
- Peak log amount per second.
- Peak indexed logs per second – Indexing the logs makes them appear in your search results and in the SmartView real-time reports.
- Log size per day.
- Number of days you retain each log.
To learn how to measure your existing logging rates, see sk120341 for how to measure your existing logging rates.
Your answers to the questions above lead to a final question:
- Should you dedicate a machine for logging separately from security management?
Deciding
After you determine your logging and management needs, refer to the 2018 Smart-1 appliance data sheet to find the appropriate Check Point appliance.
If you currently own an older model Check Point appliance, or plan to use your own server for the Check Point software, refer to the 2018 Smart-1 appliance data sheet to determine the required number of cores, storage, and memory (RAM). This also applies to deployments on virtual machines.
Another consideration that you should make prior to deploying the Check Point management and logging software on a virtual machine, is that the Security Management Server needs guaranteed RAM at all times, and the Log Management Server needs a guaranteed I/O amount. If not, you might experience performance problems. Merely having a strong virtual machine host is not enough for placing the Check Point servers within – you must also find out who its “neighbors” are going to be and the demands they will place on the Management and Log Servers.
Choosing the correct hardware is the most important decision when it comes to properly sizing your Check Point R80.10 Security Management Server and Log Management Server. In most cases, if you choose the hardware correctly, you don't need to keep reading further.
Tuning
In the previous section you decided on the correct hardware for your needs. This section guides you through some of the best practices when using Security Management, which is particularly useful if you experience performance issues.
Software versions:
We recommend that you use the latest software version along with the latest Jumbo Hotfix. Jumbo Hotfixes for each supported version are issued to the public at regular intervals.
The following Versions and Hotfixes include performance-related fixes:
| Version | Compared to version | Performance improvement description |
|---|---|---|
| R80.20 | R80.10 |
|
| R80.10 | R80 | Improved performance across the board for Security Management, Log Server, SmartEvent and SmartConsole. |
| Jumbo Hotfix take (and higher) | Performance improvement description |
|---|---|
| Take 142 |
|
| Take 112 | Performance improvements in Security Management Server when using CloudGuard IaaS. |
| Take 103 |
|
| Take 79 | Improved policy installation time. |
| Take 37 | Improvements to assign global policy time for Multi-Domain environments and for Management High Availability. |
Tuning security management operations performed by the Management APIs:
- Note: We refer mainly to Management API calls. There is no need to limit the work done by your administrators. It is the scale of automated work that can cause management server overhead.
The number of concurrent sessions:
How many concurrent admins are logged in? Consider using the same read-only session for all read-only operations, especially if you perform many API operations. Each log-in has an overhead. A log-in for reading and writing has more overhead than a log-in for read-only.
You can change the maximum allowed number of concurrent read/write sessions. You can reduce the default number (100) to ensure you do not open too many sessions.
Use the show-changes command:
Traversal of the entire security management database, e.g. exporting entire security policies and all objects that are referenced to them, or exporting all network objects, especially with large environments or with repetitions of such exports, results in high I/O and RAM rates. If you use the security management APIs for constant export and imports of data, consider utilizing the automatic revisions that come with the R80.10 Management Platform. The show-changes API command receives start and end dates, or session IDs, and returns the created, deleted and changed configuration objects. It is more efficient than working on the entire security management configuration.
Limiting the size of paged results:
All API commands that return the list of objects, such as show-hosts and show-access-rulebase, are limited by default to 50 results. This is determined by the “limit” parameter as part of the API request. The “limit” parameter has a maximum value of 500. If you have an automatic script that causes performance issues on the Management Server, check the value of the limit parameter. If the script uses a larger value for “limit”, consider decreasing it.
If you still experience performance issues, especially when the returned objects are large in size (for example, if each object has hundreds of fields), consider decreasing the “limit” parameter to less than 50.
The difference between “details-level standard” and “details-level full”:
- All API commands that return an object or a list of objects have the details-level parameter. It has 3 options:
- UID - Will only return the unique identifier. Each object can later be called on a separate API command given its UID.
- Standard - Returns a subset of the object’s fields, generally the most common ones. This is the default.
- Full - Returns all the fields of each object.
- In details-level full, one of the things returned is objects which reference the object you were looking for. For example, “show host name <name of host> details-level full” returns the host’s properties as well as details on every group or rule that contains this object. If you frequently use many parallel Management API calls to get these linking objects, this could result in excessive calls at the Management Server, as well as large sizes of the resulting objects by the API. Both of these can lead to a performance impact. If you do not plan to use this additional information in every call, consider adding “show-membership false” to your request. For more information about the show-membership option, see sk121292.
- Another optimization option for object retrieval with “details-level full” is the number of details you wish to see for a sub-element that this object contains. For example, if a group object contains a few members, if you are only interested in the UID's of the members, consider adding "dereference-group-members false" to your request and save on performance. For more information about the dereference-group-members option, see sk121292.
Tuning your log policy:
Indexing days:
The Log Management Server keeps indexed logs for the last 7 days by default. Older log data can be retrieved but with a noticeably slower response time. The activity of indexing logs impacts the disk read/write capability.
To increase or reduce the number of days the logs are indexed:
- In SmartConsole, edit the Log Server Object.
- Change the log indexing properties.
- Publish your changes.
Logging less data:
- You can choose to stop logging traffic that is considered expected, such as DNS queries and more, by changing the Track option in its rule to none. Logging less data per second can decrease the disk I/O load and the processing of the log indexing.
- Security policies in R80.10 include new Track options: Detailed log and Extended log. These options add additional data in every log card regarding the relevant application, resource and file processed even for rules which do not explicitly specify applications or content. However, adding information to each log entry results in an increased workload at the log server. If you experience performance problems with your Log Management Server, consider re-evaluating these options.
- You can also reduce the track level at various other places in your security policy, such as adding packet capture to IPS protections and Threat Prevention policy rules, logging implied rules, and more.
Use of hyper-threading:
For R80.10 Security Management, we recommend you keep hyper-threading off for performance reasons. When hyper-threading is enabled, this can increase the load on the storage kernel driver at the R80.10 Gaia operating system. Read more about hyper-threading at Intel.com.
Note - This recommendation is only for R80.10. It may change for R80.20.
The Management Performance Profiles:
The Security Management Server uses Java (powered by IBM). When the Check Point Management process starts up, it allocates the most appropriate RAM sizes for the heap, the garbage collector, and number of parallel threads, based on the user’s RAM at the point of the start-up, as well as:
- Is it a Security Management Server
- Is it a Log Server
- Is it a Standalone configuration (Management and Gateway)
- Is it a SmartEvent Server
- Is this the import phase of an upgrade
The performance profiles help split the available memory between the Security Management and the Log Management processes if they run on the same server, or alternatively, allocate more resources to one of them if it is a dedicated server.
The formula is described in an internal configuration file and is based on profiles. Each profile consists of filter and result.
During the process start-up (typically during cpstart or mdsstart), the performance profiles file is processed from the top. The first filter values that match the user’s current machine properties determine the performance profile.
To find the name of your performance profile, run:
grep CHOSEN_CPSETUP_PROFILE $MDS_FWDIR/conf/cpmServerSettings.props
The performance profile configurations are set at:
$CPDIR/conf/CpSetupInfo_resourceProfiles.conf
You can modify these parameters, but we advise you do that only if you are aware of possible consequences. Improperly configured performance profiles can result in software lags, server overload during policy installation, or affect other processes that run on the Security Management Server. However, we still believe you should be aware of the numbers and the profile that is chosen for your environment.
Before you make any changes, make sure that you back-up this configuration file. When you upgrade to a later Security Management version, this file reverts to its default.
Locate your performance profile at the file and see these outcome values:
- NGM_CPM_MAX_HEAP - Maximum heap memory size for the Security Management Server (based on Java)
- NGM_CPM_SOLR_XMX - Maximum memory size for the full-text search engine for the Security Management Server (based on Solr)
- RFL_RFL_MAX_HEAP - Maximum heap memory size for the Log Management Server
- SMARTVIEW_MAX_HEAP - Maximum heap memory size for the SmartEvent Server (based on Java)
- NGM_WEB_API_MAX_MEMORY - Maximum heap memory size for the Management API process (based on Java)
- NGM_WEB_API_JRE_64 - "1" if the Management API process should run on a 64-bit Java machine, which allows you to set a maximum Heap Size greater than 4Gb with NGM_WEB_API_MAX_MEMORY.
We recommend that you consult with Check Point Support before you modify any of these values.
Extending
Multiple servers:
You can add additional Management Log Servers and split the log processing load between them. The customer experience is not affected: when a user browses SmartLog or enters a filtering query, all log servers are queried together.
- Use the Gateway Editor in SmartConsole to configure to send logs from different gateways to different log servers.
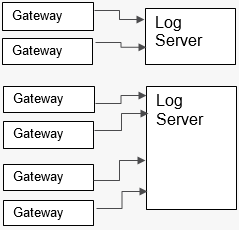
Figure 2: Distribution of Log Management Servers to serve different gateways.
With a Multi-Domain Management environment, you can configure to use different log servers for gateways and Security Management Servers located in different domains.
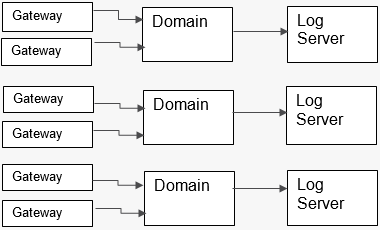
Figure 3: Distribution of Log Management Servers to different Management Domains.
You can use High Availability for Security Management Servers and Log Servers in both multi-domain and single-domain management environments. The R80.10 Security Management architecture has the secondary servers with constant up-to-date data. As a result, you can move read-only queries to the secondary server and reduce the workload at the primary server, using it mostly for read-write operations.

Figure 4: Offload your read-only queries to the secondary peer in a High-Availability environment for Single-Domain Security Management Servers and Log Management Servers.
In High Availability in multi-domain environments, you can assign a different primary server for different domains.
To change the server for a domain: In SmartConsole, login to the MDS domain and go to the Domains view.
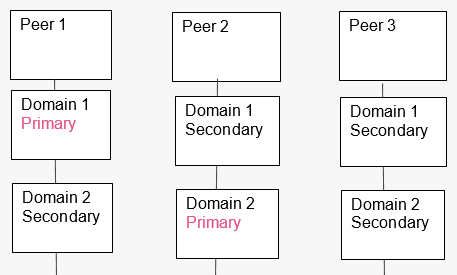
Figure 5: Distribution of primary and secondary Management Domains at different servers.
Extending your server’s hardware:
- SSD or RAM - what is better?
- If you can choose:
- For Log Management Server: Start with SSD and continue with RAM. The logging and log indexing processes rely on frequent disk I/O calls. Therefore, if you increase the disk performance, this directly affects the log server, while more RAM can also be useful. SSD can improve log query response times.
- For Security Management Server: Start with more RAM. The majority of the Security Management Server processes consist of configuration changes, install policies or traverse object sets. Validating the data, as well as ensuring reliable results for each request call, are the key components. Therefore, adding more RAM allows more space for the active processed requests.
For Virtual Machines, the Security Management Server needs guaranteed RAM at all times, and the Log Management Server needs a guaranteed I/O amount.
- If you can choose:
Indicators of performance problems
In this section, we will look at specific cases of performance-related problems, and point to possible solutions.
Please note that not every issue is a sign of a performance problem. Sometimes it could be a misuse of the software or a software bug.
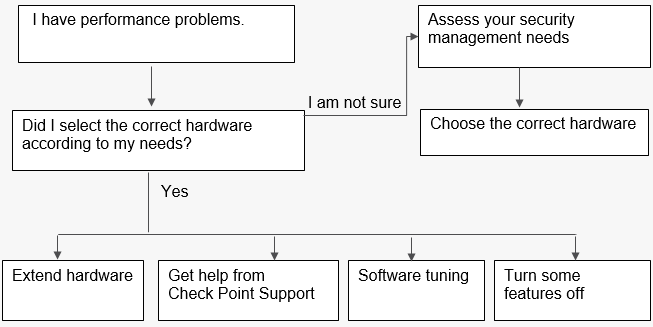
Figure 6: A self-assessment process if performance problems occur.
Examples of issues which are considered to be performance problems:
- Slow responsiveness when working with the SmartConsole GUI application.
- SmartConsole shows the message “you have been disconnected from the Security Management Server” while the network connectivity is stable.
- Slow responsiveness or timeouts when using the Management API.
- Delay in seeing the most recent logs.
- Filtering logs does not return all relevant logs due to potentially slow indexing.
- Slow policy installation time.
I use specs that are comparable to the Appliance Sizing Guide but I am still experiencing performance issues. Is the guide wrong?
- Make sure that you have guaranteed, not average, I/O for logging and guaranteed RAM for Management and logging.
- If you still experience issues, open a support ticket. We are very interested in fixing root causes for the benefit of all our users.
Running the “top” command on my servers shows that Java or Solr consumes 100% and more of the CPU. Is that a bad sign?
- This is not necessarily a sign of performance problems. Often times, we confuse 100% CPU with a problem. On the R80.10 Security Management architecture, the Java-based processes consume CPU in low priority. The fact that something is consumed does not necessarily mean that it is creating a problem with the machine.
- In general, for Security Management Servers and Log Management Servers, you should not solely rely on process counters as indicators for performance issues. If performance-related problems occur, they are felt through slow user experience and things you notice as you use the products, and not necessarily as statistical measurements of processes.
- However, if you experience slowness when you run SmartConsole or the Management APIs, and the tuning advice did not eliminate the problem, you can try to improve the logical execution of the Java-based process on the Security Management Server:
- Run the "top" command in thread-resolution mode (Shift +H). If the thread that is running the most is called “GC Slave”, you can increase its buffer size by doubling the “max heap” parameter as part of the Management performance profiles. Execute this change with great care, if possible outside of working hours, and only after consulting with Check Point Support, as you may encounter some unexpected behavior.
- For more information on high CPU utilization for “Java” process on R80.10 Security Management Servers, refer to sk123417.
SmartConsole is slow in some cases, or SmartConsole randomly disconnects users:
General considerations:
- An update to the R80.10 SmartConsole from May 2018 includes a significant performance improvement when working with large security policies. This improvement is also included in versions higher than R80.10.
- If you experience slowness with the user interface of the Logs view or with the Security Policies view when the active tab at the bottom is the “Logs” tab, consider using SmartView: SmartView, the web-based log viewer, available to all users, may solve some of the lags with the integrated SmartConsole log viewer. To access SmartView, go to: https://<log server IP>/smartview
- Some of the performance issues could be an indicator of a software bug and not a result of undersized servers. We always advise opening a support ticket every time you experience a lacking user experience including slowness with the user interface.
Extending the maximum connectivity timeout values:
- SmartConsole relies on constant interaction with the Security Management Server. The default timeout values are typically 1 minute for any client-server communication, 5 minutes for file upload and download and 5 minutes for sending command-line calls with the SmartConsole CLI window. Under some circumstances, such as long geographical distance or low Internet bandwidth, these values may need to be increased.
- You can control the maximum timeout values by editing the SmartConsole.exe.config file in the same folder of your SmartConsole application executable. Find the <CommunicationLayer> XML element and increase the relevant TimeOut values. You can also find the <Connection> XML element inside the <ClientIS> XML element and increase the value of KeepAliveSessionTimeoutSeconds from the default 30 seconds.
Command-line tools which can help you assess a performance problem:
- To measure your log rate and log indexing rate, use the cpstat command.
- To find out which processes take the most I/O in R80.10, run:
echo 1 > /proc/sys/vm/block_dump
watch -n 1 'dmesg | egrep "WRITE|READ|dirtied" | cut -d: -f1 | sort | uniq -c | sort -nr'
echo 0 > /proc/sys/vm/block_dump
To stop measuring, run:
echo 0 > /proc/sys/vm/block_dump
- To identify whether some of the processes have high memory swaps, especially when running Log Management Servers in VMWare, run vmstat 5 for measurement with a 5-second delay.
- After you run these commands and analyze their results, if case you find that there are I/O intensive processing in your environment, this could lead you to deciding to extend your machines, tune the software, or ask Check Point Support for assistance.
My disk space runs out quickly. How can I tell which logical process causes it?
The Log Management Server stores its logs and indexes in the following directories:
- $MDS_FWDIR/log_indexes
- $RTDIR
The Security Management Server stores its configuration data in the following directories:
- $PGDIR
- $SOLR_DIR
- $MDS_FWDIR/conf - during Policy Installation, this folder gets updated with the compiled policy before sending it to the gateways.
Finding out which logical process causes the majority of the disk consumption can help you distribute your process allocation in the machine or extend the environment accordingly.
Check Point wants to help you.
It is likely that you are not the only user facing a particular performance problem. If you followed Check Point recommendations to determine your Security Management Server and Log Management Server hardware requirements and still experience performance issues, it may due to a software bug.
Moreover, Check Point Support currently has internal tools which identify additional indicators of performance problems given some root causes. Internally, they are called “CPM Doctor” (for the “CPM” process, which is the main executor process of the Security Management Server) and advanced features of “Doctor Log” (for the Log Management Server). These tools are not yet available publicly because they still require involvement of Check Point engineers to analyze the results given by those tools.
We are committed to finding root causes and ensuring that none of our users experience performance issues. Therefore, we strongly advise that you open a support ticket through the Check Point Support Center.
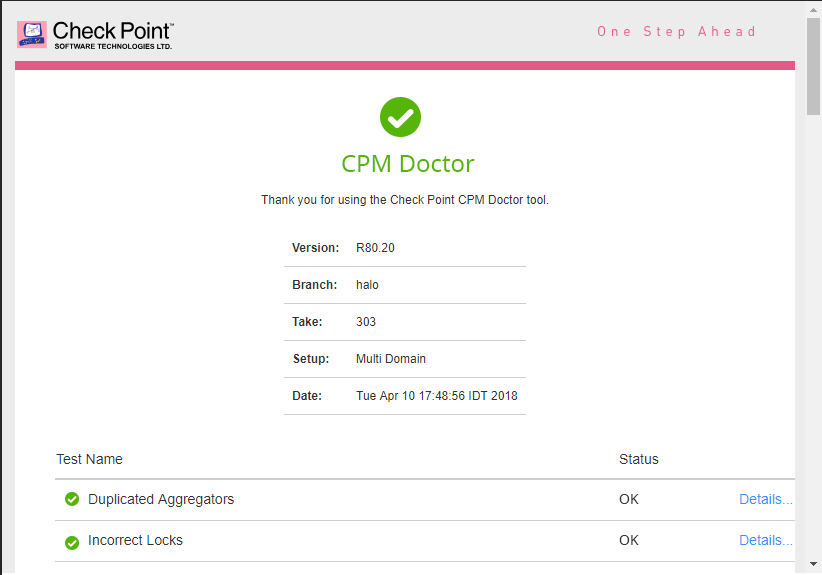
Figure 7: Sample output of an internal tool called CPM Doctor, which can be run by Check Point Support.
Turning some features off (and what will you lose)
Log fewer rules:
Getting visibility for your traffic and the actions made by your Security Gateways depends on the amount of logging you are willing to own. There are some log attributes that you can turn off to eliminate “noisy” data and reduce the consistent load on your Log Management Servers – see this section for recommendations. However, the more rules that you set with “track none” or “track networking info only”, the fewer actions are available to identify sources of malicious traffic.
Logs in non-indexed mode:
In R80.10, logs are indexed by default. Indexing logs lets you run smart filtering queries on your logs and get the results on all traffic within a few seconds. Indexing logs also sets the ground for the dashboards and reports that can be made with SmartView. Pre-R80, logs were not indexed and it took a long time to get the results of pre-defined queries.
To go to non-indexed mode:
- In SmartConsole > Log server editor, turn off Enable log indexing.
Security Management – turning off policy verification:
During the policy installation process, the Security Management Server validates that your policy does not have verification errors. The policy verification process only runs during policy installation or as the stand-alone operation verify policy. These are different verifications than the real-time validations provided in the SmartConsole validations pane. If you run verify policy during policy installation, it can impact performance. It also accounts for the vast majority of the turnaround time when performing policy installations.
During verification, the longest inspection process is to check for shadowing and overlapping rules. To disable this inspection, add this environment variable to your Security Management Server:
export fw_light_verify=1
While this reduces policy installation time, several rules may be hidden and as a result many redundant rules are not matched. This environment variable is reverted on every version upgrade.
Summary
Our goal is to provide the best visibility and operational efficiency when managing your cyber security needs. With this guide we present a process for determining the correct hardware and software for your needs, as well as pointers on improving performance when using the Security Management platform.
Visit us at CheckMates: https://community.checkpoint.com for feedback on your experience with R80.10.
For help with performance-related questions, please visit Check Point’s support services: https://supportcenter.checkpoint.com.