Working with Logs and Events
-
From the left navigation toolbar, click Logs & Events.
-
From the top, click the applicable tab.
-
In the top left corner, select the applicable view - All Gateways or a specific Spark Firewall Gateway.
-
In the top left corner, select the applicable date and time range and click Apply.
-
In the top Search field, you can configure the applicable filters.
-
In the top right corner, you can enable Auto Refresh and refresh manually.
-
Examine the logs and events for the connected Spark Firewall Gateways.

Important - You can click each counter to see more data.
-
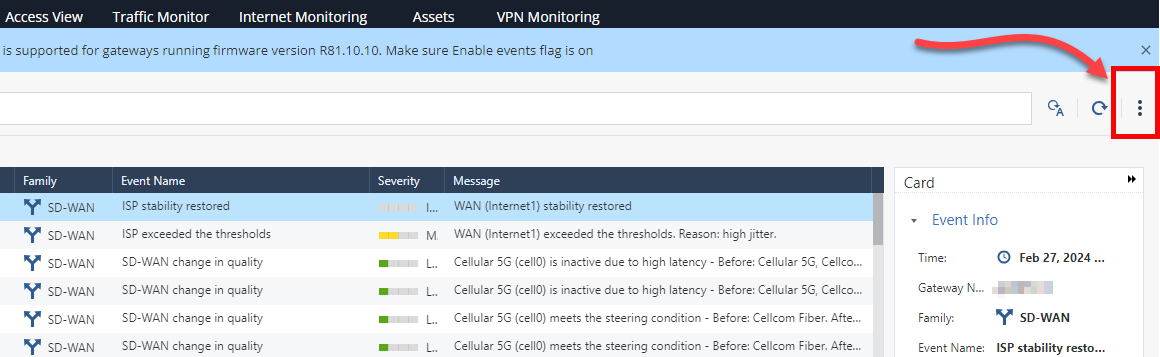
To export the applicable records, in the top-right corner, click the 3-dot icon > click Export > click the applicable export format.
These tabs are available:
Shows the traffic logs.
In the left panel, you can enable the applicable filters.
|
|
Note - Supported for Spark Firewall Gateways running R81.10.10 and higher versions. |

Shows various events on Spark Firewall Gateways.
In the left panel, you can enable the applicable filters.
Shows various administrator operations on Spark Firewall Gateways.
In the left panel, you can enable the applicable filters.
Shows the information about infected hosts on internal networks:
-
Gateways reported possible infected hosts
-
Possible infected hosts
-
Command and Control connections
-
Top 10 Gateways with hosts infected with bots
-
Top Gateways connected to Command and Control over time
Shows the information about prevented attacks (based on the configured security settings):
-
Prevented attacks:
-
Users received malicious mails
-
Hosts downloaded malicious files
-
Directly targeted hosts
-
Hosts scanned by attackers
-
Hosts accessed malicious websites
-
-
Top 10 Gateways with prevented events
-
Top 10 Gateways with a possible infection that was prevented
-
Prevented attacks trend
Shows the information about detected attacks (based on the configured security settings):
-
Detected attacks:
-
Users received malicious mails
-
Hosts downloaded malicious files
-
Directly targeted hosts
-
Hosts scanned by attackers
-
Hosts accessed malicious websites
-
-
Top 10 Gateways with detected events
-
Top 10 Gateways with a possible infection that was detected
-
Detected attacks trend
Shows various statistic counters:
-
Bandwitdh and Users:
-
Users
-
Bandwitdh Usage
-
High Risk Applications / Sites allowed by policy
-
-
Gateways Bandwitdh
-
Top blocked:
-
Top users.
-
Top sources.
-
Top destinations.
-
Top applications.
-
-
Top applications.
-
Top users by traffic.
-
Top gateways by traffic.
-
Top interface by traffic.
Shows various traffic statistic counters:
-
Top sources.
-
Top destinations.
-
Top applications.
-
Top services.
-
Throughput by interface.