Threat Hunting
Threat Hunting is an investigative tool which allows for advanced querying on all malicious and benign forensics events collected from the
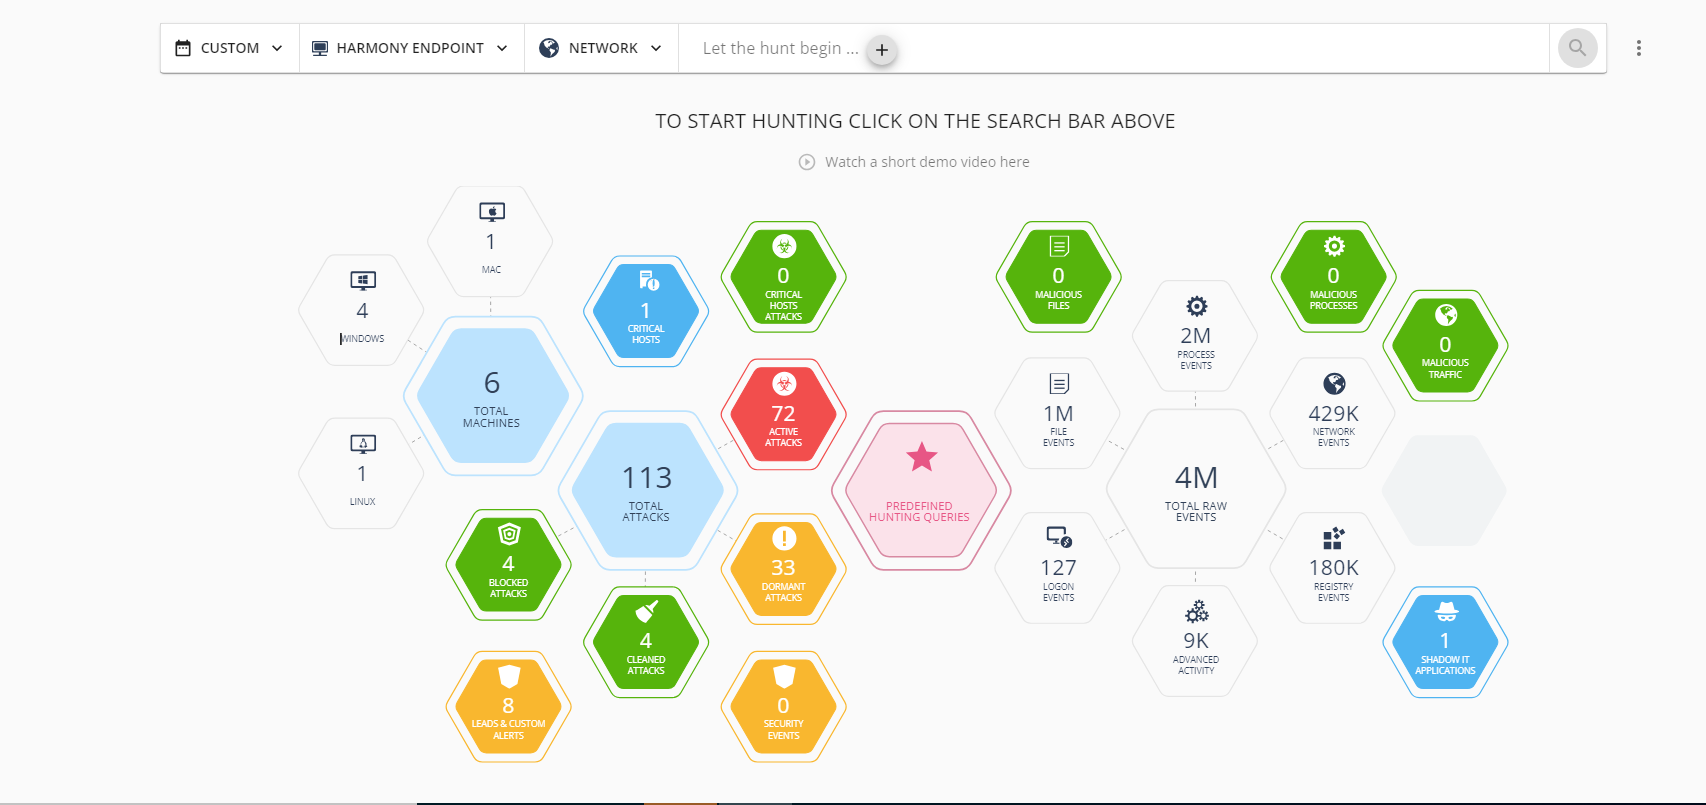
The information collected lets you to:
-
Investigate the full scope of an attack.
-
Discover stealth attack by observation of a suspicious activity.
-
Remediate the attack before it causes further damage.
-
Proactively hunt for advanced attacks by searching for anomalies, and using hunting leads and enrichment.
Threat Hunting supports:
-
Data collection and enrichment - All events are collected through multiple sensors and sent to a unified repository and enhanced by ThreatCloud, MITRE mapping and alerts from all the prevention engines.
-
Rich toolset for custom queries, drill down and pivoting to suspicious activity.
-
Predefined queries and a MITRE dashboard which map all activity and allow a quick start to proactive hunting.
-
Remediation actions per result or a bulk operation integrated in the Threat Hunting flow (such as file quarantine and kill process).
Supported Regions
Threat Hunting is supported only for the Check Point Portal tenants (accounts) residing in these regions:
-
Australia
-
EU
-
India
-
United Kingdom
-
United Arab Emirates
-
US
Supported Versions
-
Endpoint Security Client version E84.10 and higher.
-
Management version:
-
Cloud-only, web management.
-
Enabling Threat Hunting
By default, Threat Hunting is disabled in Endpoint Security.
To enable Threat Hunting:
-
Go to Policy > Policy Capabilities.
-
Click the Analysis & Remediation tab.
-
From the Enable Threat Hunting list, select On.
-
Click Save & Install.
-
After the policy is pushed to the agents, wait a few minutes until data is sent by the agents.
Then you can go to the Threat Hunting view to start searching through events.
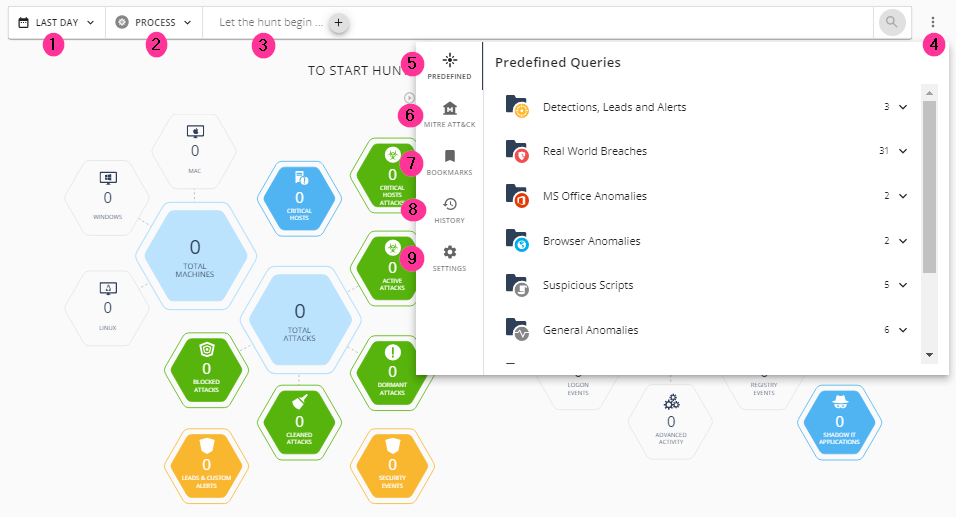
Using Threat Hunting
|
Item |
Description |
||
|---|---|---|---|
|
1 |
Last Day - Time filter for the query. Users can choose between Last Day, Last 2 Days, Last Week and a Custom time period. |
||
|
2 |
Process - Refine your query results according to the activity type. |
||
|
3 |
Let the hunt begin - Click + and define the values to search in the logs. You can add multiple values and fields at a time. |
||
|
4 |
Menu for predefined queries. |
||
|
5 |
Predefined - Check Point's predefined queries, divided by category.
|
||
|
6 |
MITRE ATT&CK - Shows the MITRE ATT&CK framework of tactics and techniques. Each technique includes one or more queries, pre-defined by Check Point Research. |
||
|
7 |
Bookmarks - Shows the custom queries saved as bookmarks, either as global (available for all users in the account) or private (available only for the user). Users can also define email notifications for these saved queries, currently limited to 10. For more information, see Saving a Query as a Bookmark. |
||
|
8 |
History - See all the queries that you used. |
||
|
9 |
Settings - Change the UI look and feel. |
To hunt for threats, you can use predefined queries or by proactively creating your own queries.
-
To use predefined queries:
-
Go to Predefined Hunting Queries or
Click the
 icon next to the search box and select Predefined.
 You can quickly find all active attacks and browse through different malicious events detected by Endpoint clients.
-
Click the
icon next to the search box and select MITRE ATT&CK.The MITRE ATT&CK dashboard provides real-time visibility on all the techniques observed by Endpoint Security across your endpoints. It maps all raw events to MITRE Tactics, Techniques, and Procedures (TTPs) regardless of status.
The MITRE ATT&CK dashboard is divided into 12 categories and each category is a stage in an attack. Each category includes multiple attack techniques.
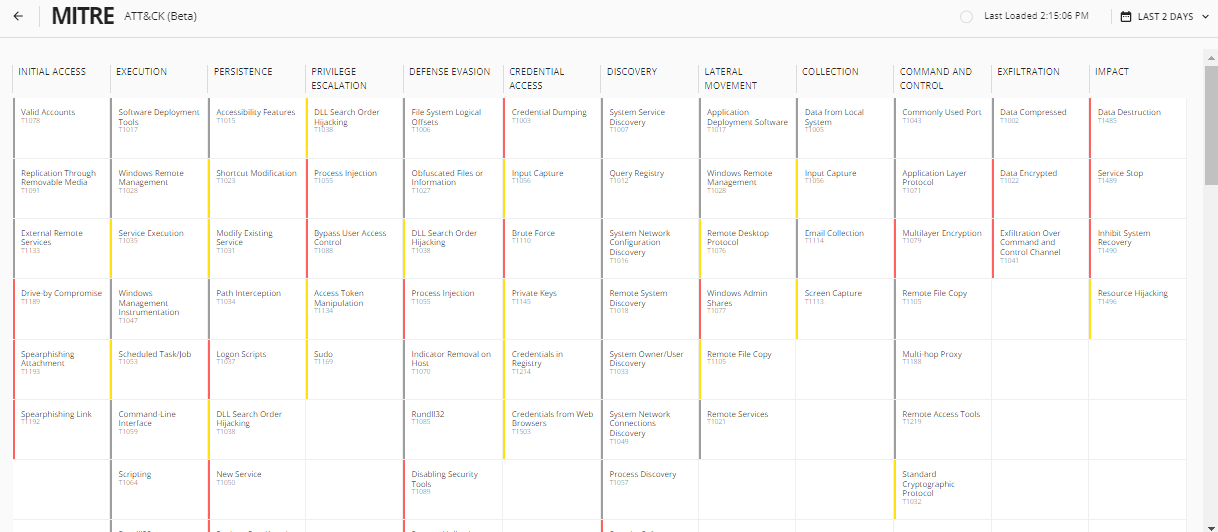
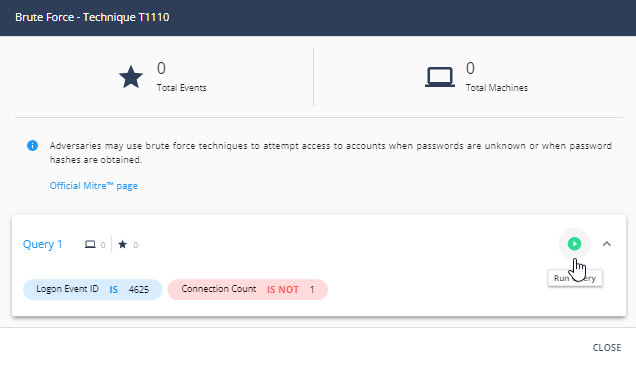
When you click a technique, a window opens with an explanation about the technique and a list of predefined queries. Run a query to get a list of the events in which the specific technique implementation was used.
-
-
To search for specific events by proactively creating your own queries:
-
Go to Threat Hunting.
-
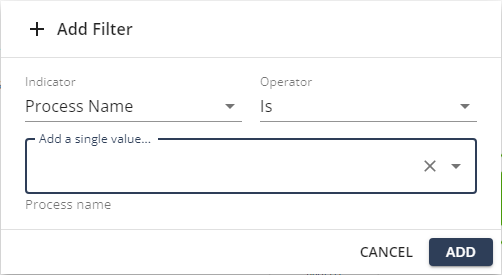
Click the + sign next to Let the hunt begin.
-
From the Indicator list, select the filter.
-
From the Operator list, select the condition.
-
In the Add a single value field, enter a value for the indicator.
-
Click Add.
It shows the search results in a timeline. The timeline provides behavioral insights that indicate anomalies or attacks.
-
To add another filter to the same query, repeat steps 2 to 6.

Note - If you have multiple filters, the system applies the logical AND operator between the filters.
-
To filter events based on the timeline, click the required hexagon.
It shows detailed information about the event, together with intelligent enrichment, such as attack classification, malware family and MITRE technique details.
-
To create a bookmark for a query, see Saving a Query as a Bookmark.
-
You can also filter the results by date and process.
-
To take remediation action for the filtered results, click Actions and choose any of these:
-
Terminate Process
-
Quarantine File
-
Trigger Forensic Analysis
-
Isolate Machine
-
-
To export the results to a CSV file, click Actions > Export to CSV.
-
Saving a Query as a Bookmark
You can add filters to a query and save it as a bookmark. You can also send email notifications to users if Threat Hunting activity matches the query.
To save a query as a bookmark:
-
Create a query.
-
Click
 from the top right corner of the page.
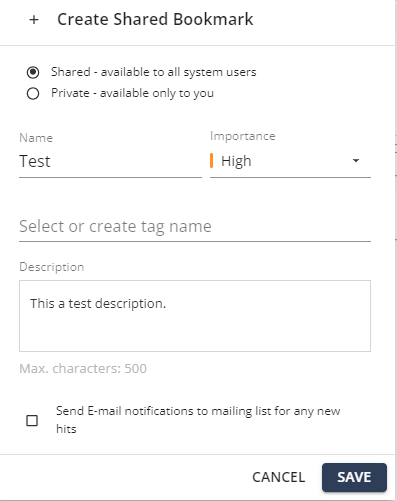
The Create Shared/Private Bookmark pop-up appears.
-
To make the bookmark public, select Shared - available to all system users.
-
To make the bookmark private, select Private - available only to you.
-
In the Name field, enter a query name.
-
From the Importance list, select an importance level for the query detection.
-
In the Select or create tag name field, enter the tag name or select the tag name if available.
Tags create folders to store bookmarked queries.
-
In the Description field, enter a description for the bookmark.
-
To send email notifications if new activity matches the bookmarked query, select Send E-mail notifications to mailing list for any new hits checkbox.
-
Click Save.
To add recipients to Threat Hunting email notifications:
-
Go to Threat Hunting.
-
Click the
icon next to the search box and select Notifications. -
From the Recipients list, select the users or enter the email address.
Use Case - Maze Ransomware Threat Hunting
You want to investigate the maze ransomware attack. You read about it in the internet and you are afraid it may already have infiltrated your organization.
-
In the MITRE ATT&CK website: Search for Maze ransomware.
- From the list of techniques that Maze ransomware uses, select the applicable technique. For example: Windows Management Instrumentation
-
From the Check Point Portal, access Threat Hunting
-
Click the
icon on the right side of the search box, and go to MITRE ATT&CK. -
In the MITRE ATT&CK dashboard, search for the technique you copied from the Maze website.
-
Click the technique to see all the events in your organization in which this technique was used.