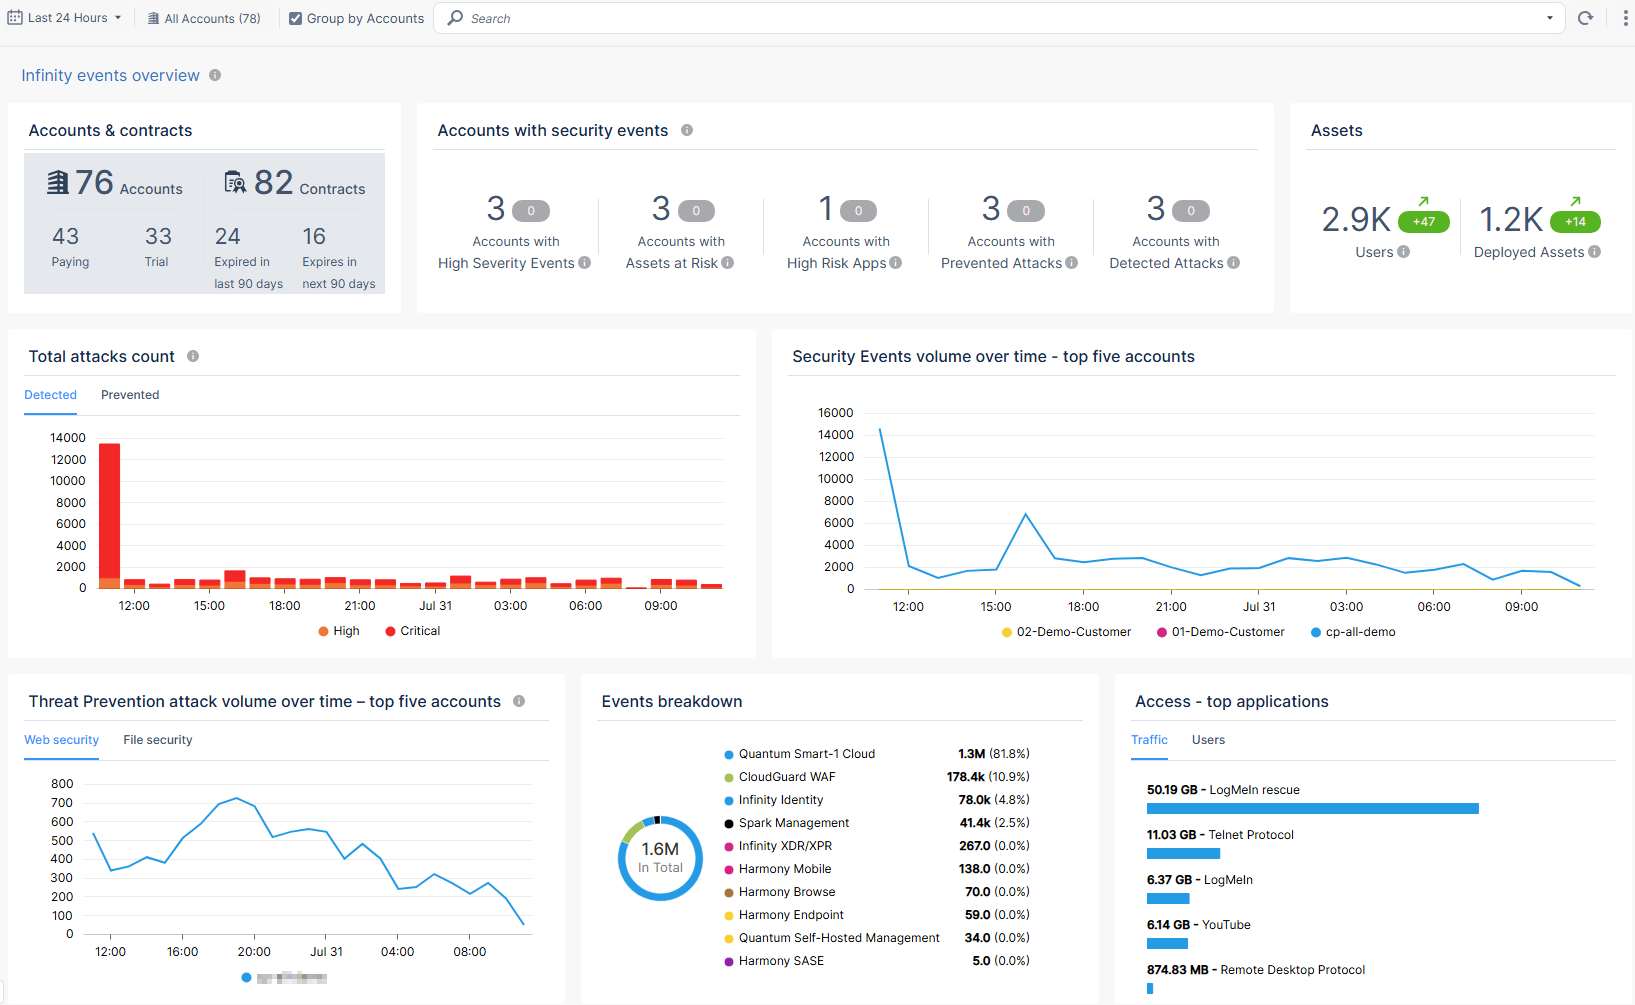
Overview
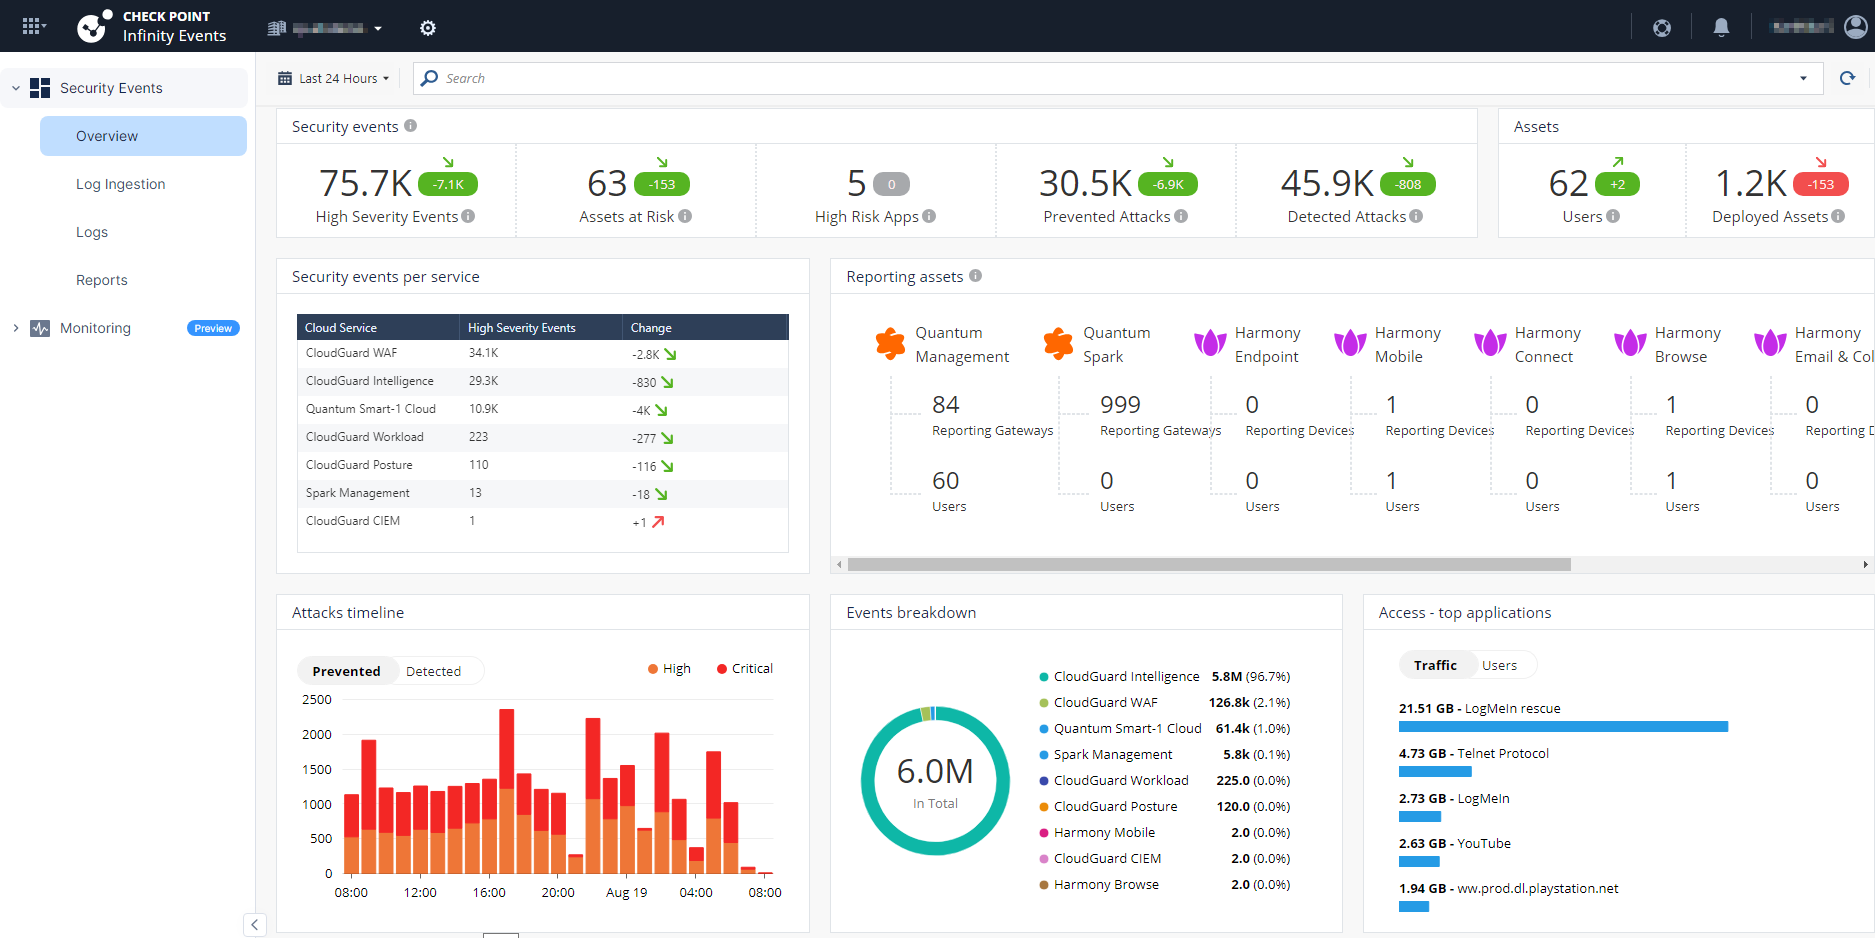
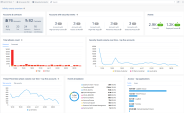
The Overview page shows the overview of security events for the Check Point products you are subscribed to in Infinity Portal.
-
Quantum Self-Hosted Management
-
Quantum Spark Management
-
Quantum Smart-1 Cloud
-
Harmony Endpoint
-
Harmony Mobile
-
Harmony Connect
-
Harmony Browse
-
Harmony Email & Collaboration
-
Harmony SASE
-
CloudGuard Posture
-
CloudGuard WAF
For an MSP account, the Overview dashboard appears the same as for normal accounts, except that it provides options to view information for selected child accounts and includes a few additional widgets related to those child accounts. See Overview Dashboard for MSPs.
To view the Overview page:
-
Log in to Infinity Events.
-
Click Security Events > Overview.
By default, the dashboard displays the overview for the last seven days.

Security Events
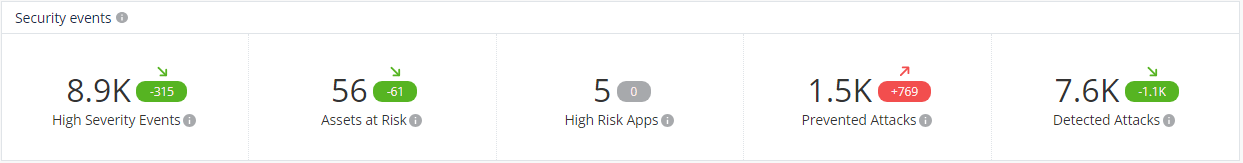
The Security events widget shows:
-
High Severity Events - The number of high severity events reported.
-
Assets at Risk - The number of assets which reported critical events.
-
High Risk Apps - The number of applications at High risk.
-
Prevented Attacks - The number of security attacks prevented.
-
Detected Attacks - The number of security attacks detected and not prevented.
Assets
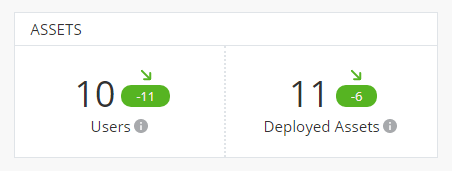
The Assets widget shows:
-
Users - Number of users that reported events.
-
Deployed Assets - Number of deployed assets.
Total Attacks Count
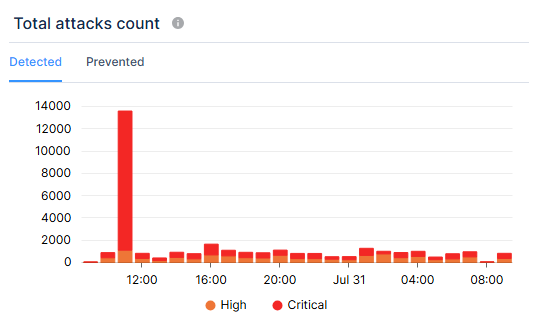
The Total attacks count widget shows the total number of attacks detected and prevented for the selected period, based on their severity.
Events Breakdown

The Events breakdown widget shows the number of events for each Check Point product.
Security Events Per Service

The Security events per service widget shows:
-
High Severity Events - Number of high severity events reported in each Check Point product.
-
Change - The difference in the number of events reported in the current and previous time periods.
For example, the selected time period is Last 7 days and the Change is -411. This means that 411 fewer events were reported in the last 7 days (11 Jan – 17 Jan) compared to the number of events reported in the previous 7 day period (4 Jan - 10 Jan).
Threat Prevention Attacks

The Threat prevention attacks widget shows the number of threat prevention events (detected and prevented) during the selected time period. To view Threat Prevention details, go to the Threat Prevention page.
Access - Top Applications

The Top Applications widget shows the internet data consumed by different users and applications such as Facebook or YouTube in the assets across Check Point products.
To view the data consumption by applications, click Traffic.
To view the data consumption by users, click Users.
Overview Dashboard for MSPs
|
|
Note - This section describes only the fields and widgets specific to MSP accounts. |

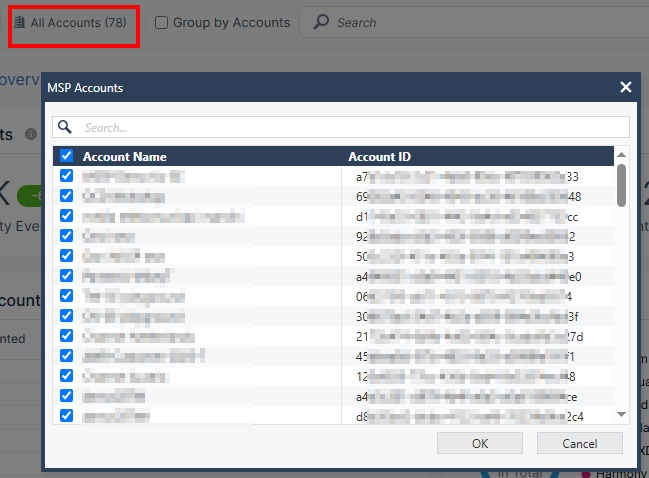
For Managed Service Providers (MSP) accounts, the Overview dashboard displays both standard and MSP-specific widgets. The data displayed depends on the selected accounts and whether the Group by Accounts option is enabled.
-
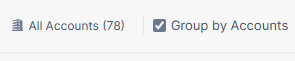
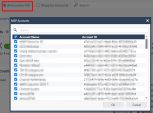
To view data for specific MSP accounts, click All Accounts and select the required accounts.
-
To group the data by accounts, select the Group by Accounts checkbox. When it is enabled, the dashboard shows the number of accounts in each widget, and not the number of events.
When the Group by Accounts checkbox is not selected, the dashboard shows the total number of events across all child accounts.
The MSP-specific widgets are described in the following sections.
Accounts and Contracts
|
|
Note - The Accounts & contracts widget appears only when the Group by Accounts checkbox is selected. |

The Accounts & contracts widget shows the summary of account types and contract statuses.
-
Accounts
Number of active and trial accounts.
-
Contracts
Number of contracts expired and soon to expire in 90 days.
Accounts with Security Events
|
|
Note - The Accounts with security events widget appears only when the Group by Accounts checkbox is selected. |

The Accounts with security events widget shows the number of accounts with:
-
High Severity Events - The number of high severity events reported.
-
Assets at Risk - The number of assets which reported critical events.
-
High Risk Apps - The number of applications at High risk.
-
Prevented Attacks - The number of security attacks prevented.
-
Detected Attacks - The number of security attacks detected and not prevented.
Security Events Volume Over Time - Top Five Accounts
|
|
Note - The Security Events volume over time - top five accounts widget appears only when the Group by Accounts checkbox is selected. |
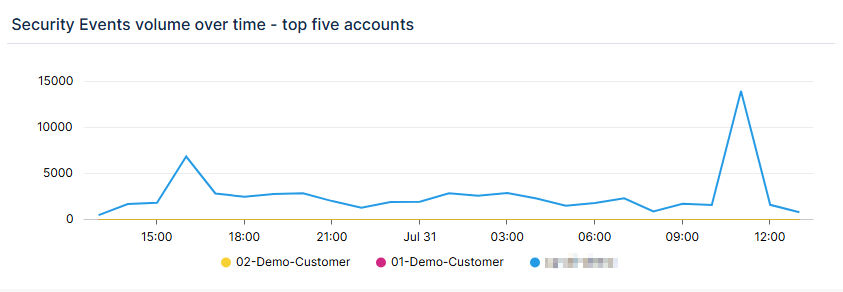
The Security Events volume over time - top five accounts widget shows the top five child accounts based on the number of security events.
Threat Prevention Attack Volume Over Time – Top Five Accounts
|
|
Note - The Threat Prevention attack volume over time – top five accounts widget appears only when the Group by Accounts checkbox is selected. |
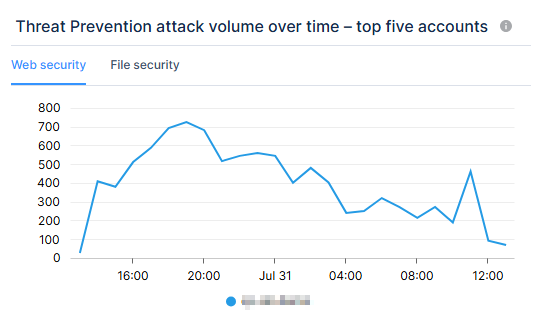
The Threat Prevention attack volume over time – top five accounts widget shows the top five child accounts based on the number of threat prevention events (detected and prevented). To view Threat Prevention details, go to the Threat Prevention page.