Logs
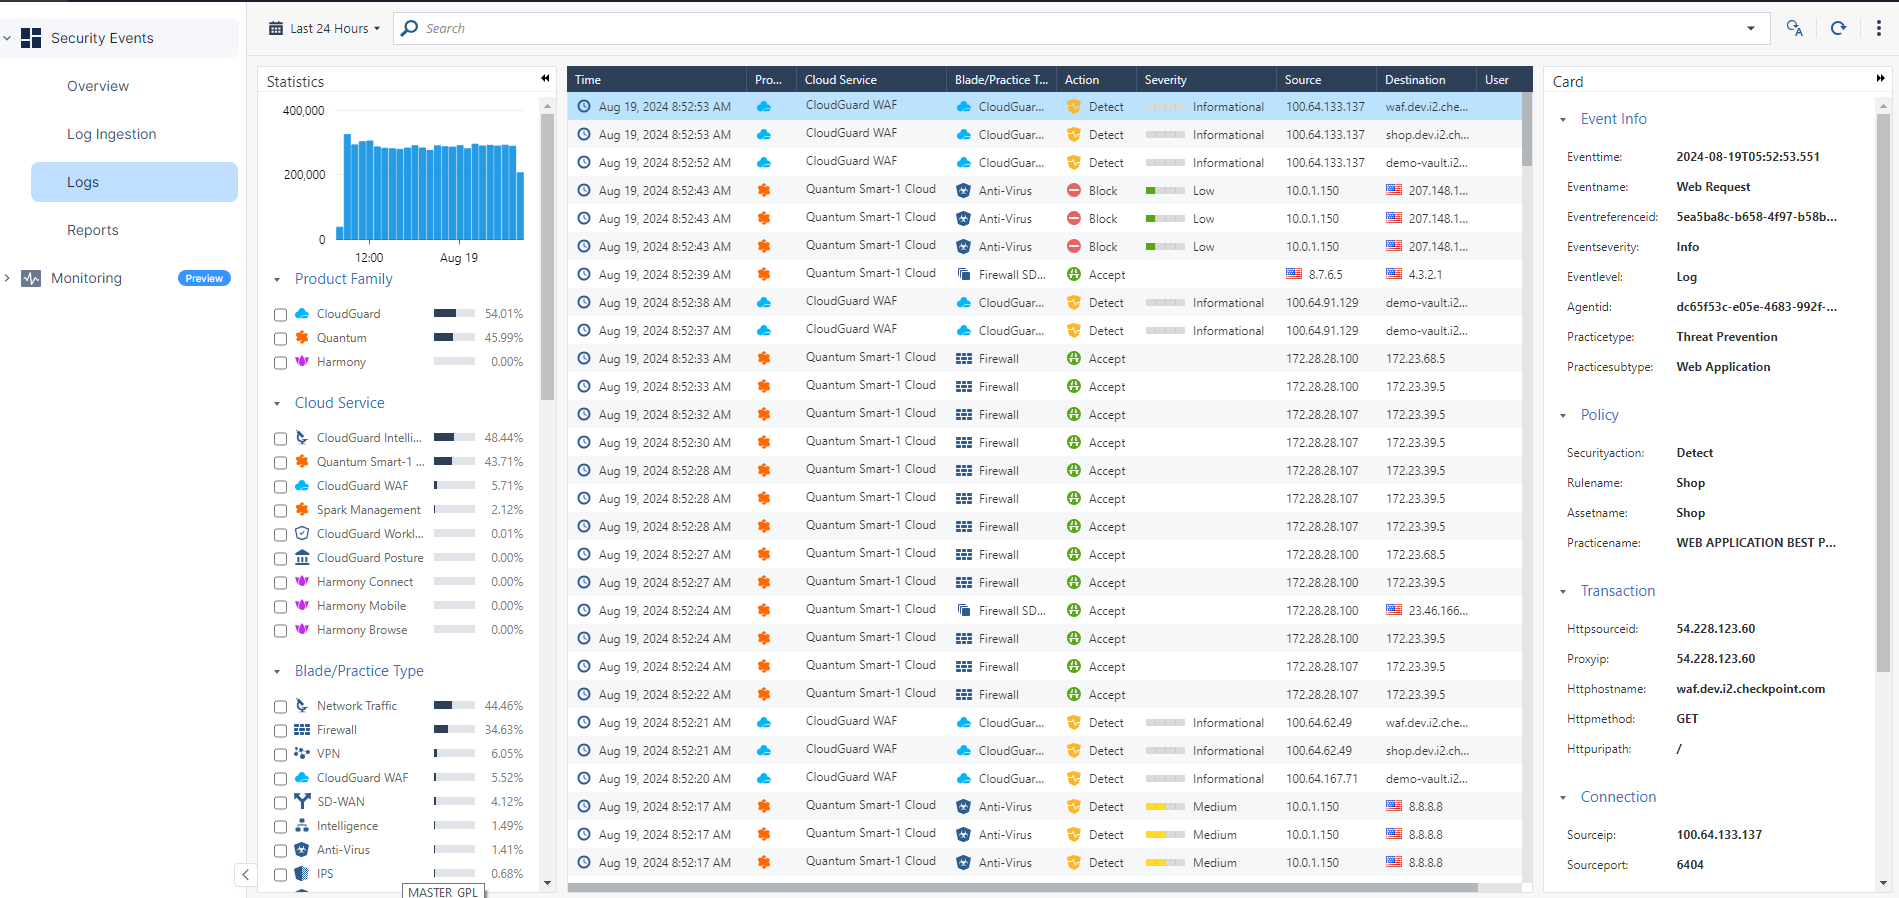
The Logs page provides a unified interface to view security events of products supported by Infinity Events.
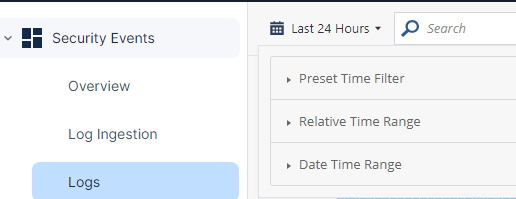
To view the Logs page, access Infinity Events and click Security Events > Logs.
|
|
Note - The default log retention duration is 90 days. To extend the duration to 180 days or 365 days, contact Check Point Support. |
Viewing MSP Child Account Events
By default, the Logs Table shows events for all the child accounts of an MSP account.
To view events for an MSP child account:
-
In the Logs window, click All Accounts.
The MSP Accounts window appears. By default, all child accounts are selected.

-
Select the checkbox for the required child account and deselect the others.
-
Click OK.
|
|
Note - To manage child accounts under an MSP, go to Global Settings > Account Management. |
Statistics
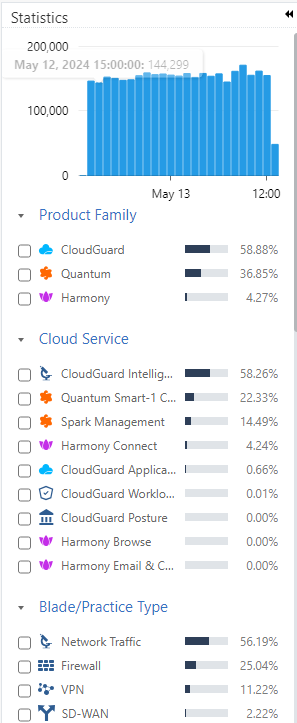
On the Statistics pane, you can:
-
See a bar graph of the number of events for the selected time frame.
-
Filter the event data in Logs Table. For example, you can filter the events data for a product family,

Note - As the logs for Log Sharing cloud service are distributed between Quantum Smart-1 Cloud and Log Sharing, the system may show inaccurate statistics in the Cloud Service section.
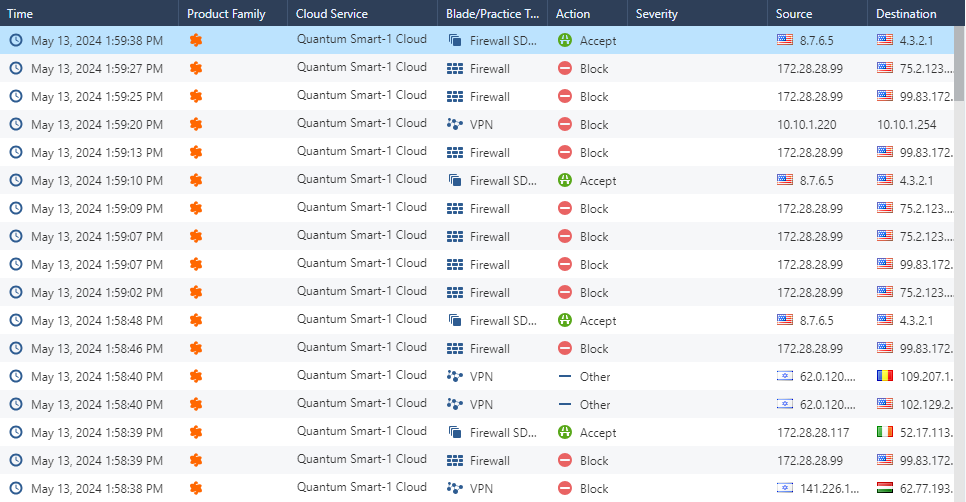
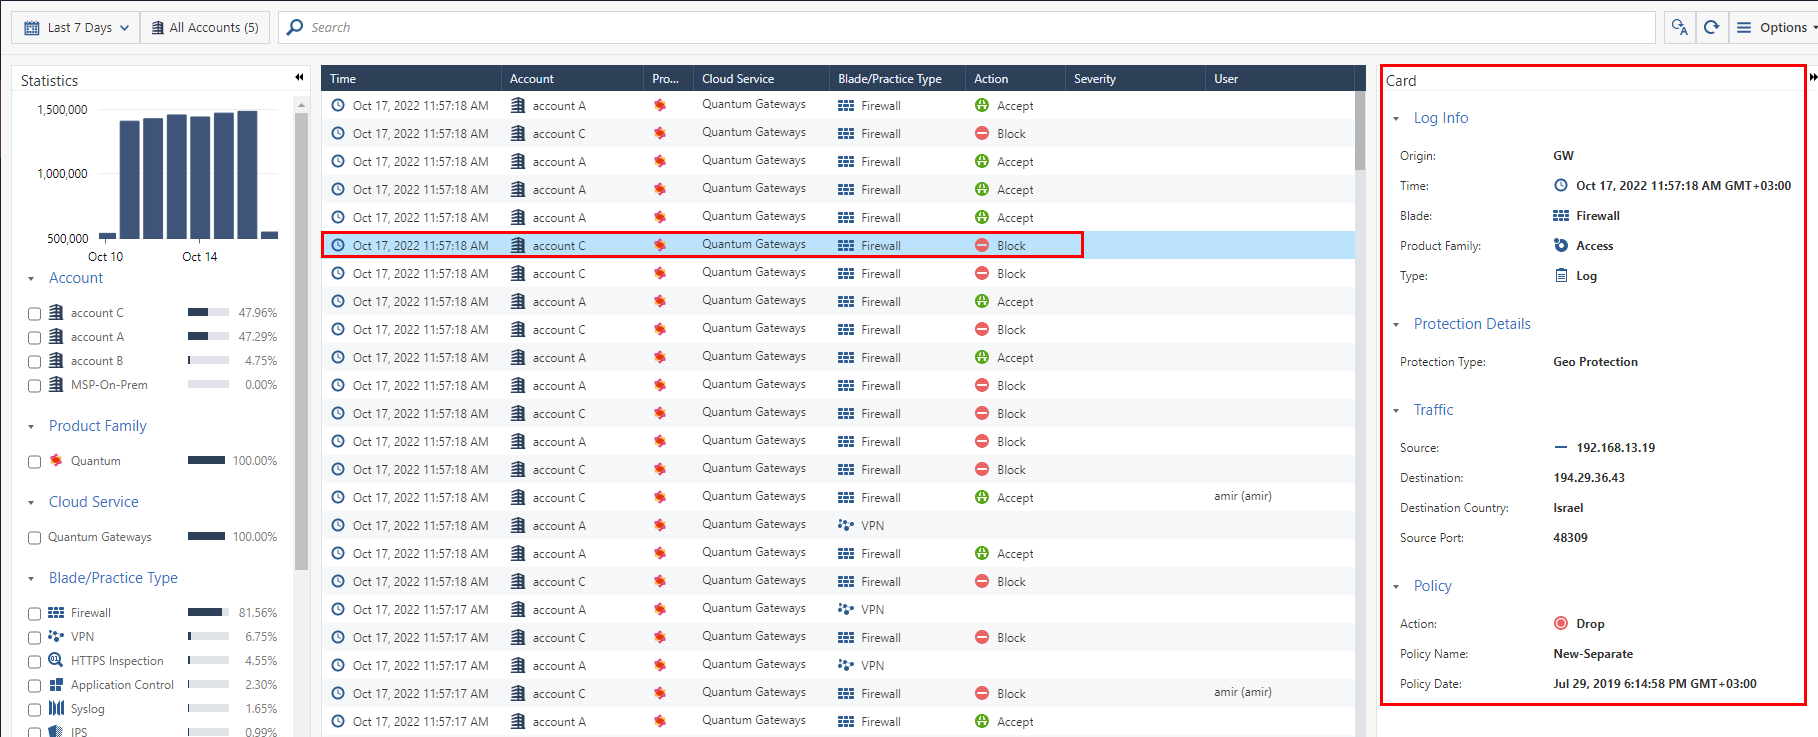
Logs Table
|
Field Name |
Description |
|---|---|
|
Default Fields |
|
|
Time |
Time of the event. |
|
Account |
Account name. |
|
Product Family |
Check Point product family. For example, Quantum, Harmony or CloudGuard. |
|
Cloud Service |
The cloud service used by the Check Point product. For example, Quantum Gateways. |
|
Blade/Practice Type |
Software blade that triggered the event. For example, Firewall, VPN, Syslog. |
|
Action |
Action enforced on the event:
|
|
Severity |
Severity of the event:
|
|
User |
User logged in at the time of the event. |
|
Additional Fields |
|
|
Alert |
Type of alert generated for the event. For example, spoof alert, mail. |
|
Destination |
Destination IP address. |
|
Direction |
Direction of the network traffic:
|
|
Domain |
Domain name sent to DNS request. |
|
Log ID |
Unique identity for logs. Includes Type, Family, Product/Blade, Category. |
|
Message |
Message displayed for the security event. For example, remote access client IP address and port were changed. |
|
Origin |
Name of the first Security Gateway that reported this event. |
|
Source |
Source IP address. |
Managing the Logs Table
-
To view the details of a specific log, double-click the row.
-
To view the default columns, right-click the table header row and click Default.
-
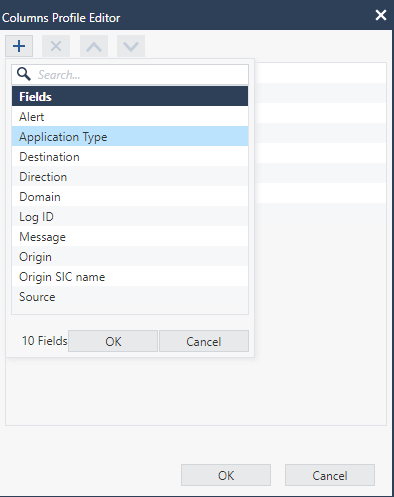
To modify the table columns, right-click the table header row and click Columns Profile Editor.
-
To add a new column to the table:
-
Click +.
-
Select the column from the list and click OK.
The new column appears in the
-
-
To remove a column from the table:
-
Select the column you want to delete and click X.
-
Click OK.
The selected column is deleted from the
-
-
To sort the columns:
-
Select the column.
-
To move the column higher in the order, click
 .
. -
To move the column lower in the order, click
 .
.
-
-
Click OK.
The column position is updated in the
-
Viewing Logs for a Time Period
By default, the
To view
-
Preset Time Filter
-
Relative Time Range
-
Date Time Range
Searching for Events
You can search for events using free text or a filter.
-
To search using free text, in the Search field, enter the text and press Enter.
For example, if you enter Block, the search results show all the blocked events.
-
To search using a filter, click the Search field, select a filter and enter the text.
For example, if the filter is Blade/Practice Type and text is URL Filtering, search as Blade/Practice Type:"URL Filtering".
The search results show all events with Blade/Practice Type as URL Filtering.
Note - You can use logical operations AND, OR and NOT in the search.
For example, Block AND URL Filtering shows the blocked events with Blade/Practice Type as URL Filtering.
Adding a Search Query to Favorites
-
Run the search query.
-
Click the
 icon at the end of the Search bar.
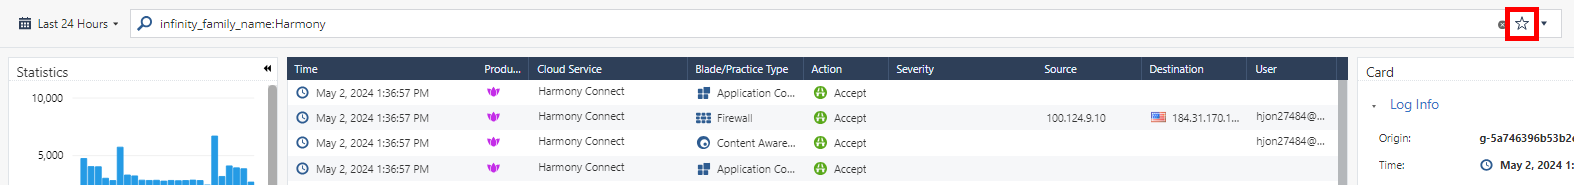
-
Enter a name for the query and click Add.
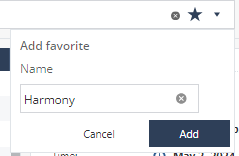
The query is added to the Favorites list.
-
To view the Favorites list, click the drop-down in the Search bar.

Exporting Logs
You can export events from the
-
In the
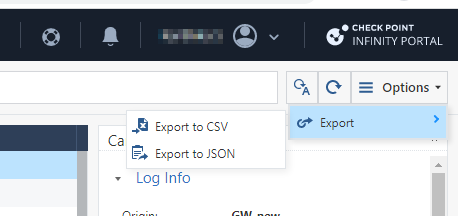
-
Select one of these output file formats:
-
Export to CSV
-
Export to JSON
-
-
Enter the information for these fields:
-
In How many logs to export drop-down, select the number of logs you want to export.
-
In Exported Columns, select whether to export event data from Visible Columns or from All Columns.
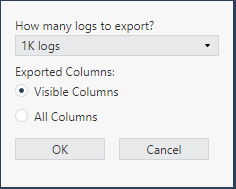
-
-
Click OK.
For CSV output, system generates an Excel sheet with the file name format: Events_Logs_Date_Time.xls.
For JSON output, system generates a json file with name format: Events_Logs_Date_Time.json.
Example, Events_Logs_Oct_17_2022_01_48_24_PM.
Card
The Card pane shows the details for the event selected in the Logs Table.
API Support
You can use REST APIs to query security event logs generated by Check Point products that are included in Infinity Events.
To access Infinity Events API:
-
Go to Check Point API Reference.
-
Click the Infinity tab.
-
In the Infinity Events API widget, click Open.