Viewing App Statistics
|
|
Important Update - Harmony App Protect End of Support
Check Point’s Harmony App Protect will be end of support soon. For more information on key actions and timelines, see Harmony App Protect End-of-Life - Check Point CheckMates. |

When your customers start to use your mobile application integrated with the Harmony App Protect SDK, you can view the app statistics.
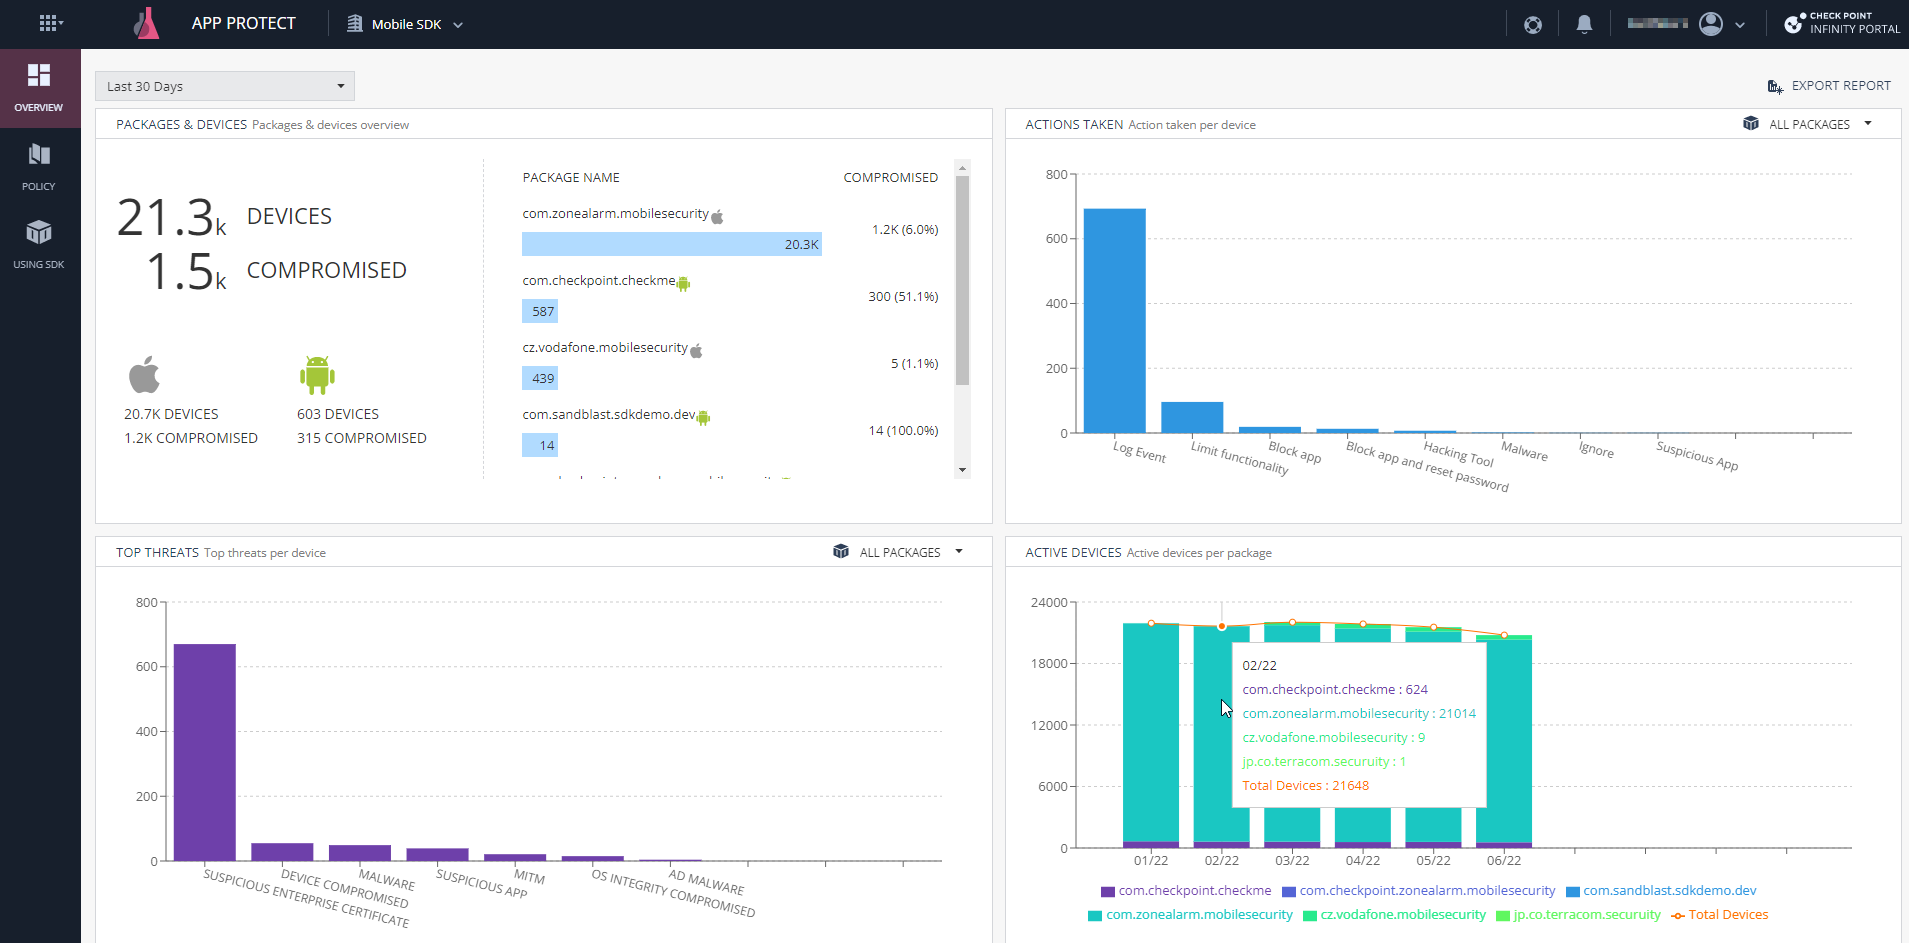
To view the app statistics, click Overview. The system shows these statistics:
-
Packages and Devices
-
Displays the deployment status of the SDK packages and devices in your organization.
-
Displays the total number of Active and Compromised devices.
-
Displays the separate device count for Android and iOS platforms and for each packages.
-
-
Actions Taken
-
Displays the device count for the different actions taken by the Harmony App Protect on the hosting application.
-
To view this information for a package, select the specific package from the All Packages drop-down list in the top-right corner.
-
You must review the action taken by the Harmony App Protect SDK and implement the business logic to protect the application.
-
-
Top Threats
-
Displays the total number of devices detected for the different active threat types. If a device has more than one active threat, all are displayed.
-
To view this information package-wise, select the specific package from the All Packages drop-down list in the top-right corner.
-
-
Active Devices
Displays the number of active devices per package, for each month.
|
|
Notes:
|

Exporting the Harmony App Protect Report
You can generate a monthly report to view the consolidated app statistics. You can either generate the report instantly or subscribe to receive it on a monthly basis.
To generate the report instantly:
-
Click the Export Report on the top-right corner of the Overview page.
-
Click Generate Report Now.
The Harmony App Protect monthly report is generated and sent to the registered email address.
To subscribe to the monthly report:
-
Click the Export Report on the top-right corner of the Overview page.
-
Select the Send me Harmony App Protect report on a monthly basis checkbox.