Introduction to CloudGuard Dome9 App for Splunk
Check Point CloudGuard Dome9 ("Dome9") is a Security and a Compliance solution for the Public Cloud.
When granted access to a user's cloud environment, Dome9 will continually run assessments for compliance to a number of best-practice standards (and user custom-designed policies as well) and generate findings in real-time for issues that need to be rectified.
The Check Point CloudGuard Dome9 App for Splunk is used visualize and monitor findings generated in Dome9 that have been sent to Splunk.
There are two dashboards - Alerts and Insights.
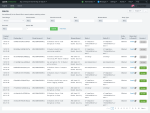
Use the Alerts dashboard to see alerts and create Exclusions.
Use the Insights dashboard to visualize findings.
Splunk Configurations with Dome9
Standalone (single-server) configuration
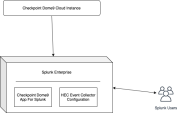
In this configuration, install the App on the Splunk instance, as shown in the figure below.
About the Installation
Install the App in one of the following ways:
-
from the Splunk user interface - Manage Apps.
-
extract the compressed files (
Check Point_dome9_app_for_splunk-Sxx-x.x.x-x.spl) into the$SPLUNK_HOME$/etc/appsfolder, and restart the Splunk server.
Distributed configuration
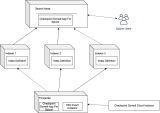
In this configuration, install the App and Add-on as shown in the figure below.
|
Component |
Forwarder |
Indexer |
Search Head |
|
Check Point Dome9 App For Splunk |
Yes |
No |
Yes |
Check Point Dome9 App for Splunk
The Check Point App for Splunk App collects data from Check Point Dome9, enriches it, and then imports it to Splunk.
You can also use it to exclude actions (in Dome9), and to open findings in Dome9.
It has some visualization which you can use to provide insights on findings.
The data collection from Check Point Dome9 uses the Splunk HEC (HTTP Endpoint Collector).
Index, Source, and Source type
In Splunk, raw data is stored in indexes.
For Check Point Dome9, you can select the index when creating the HEC event collector token.
Index and Source type are default Splunk fields, used to categorize and filter the indexed data, and to narrow down search results.
The table below shows how the Check Point data is distributed in these fields.
|
Source Type |
Description |
|
Check Point:dome9:alerts |
This data contains all the information of findings generated by Check Point Dome9 |
Splunk components used by the Dome9 App
The Dome9 App uses these Splunk components:
-
Heavy Forwarder: used to parse the time field and assign reportTime as _time. Follow the steps in the next section, to configure this component.
-
Indexer: used to create an index, when collecting data in a custom index
-
Search head: used for search-time field extractions, visualization, and to take exclude actions from the Alerts dashboard.
Dashboards
The application has dashboards for different use cases, such as findings visualization, and actions such as Exclude and Open findings in Dome9.
Insights Dashboard
This dashboard gives overall insights of the findings generated by Check Point Dome9 for a specific cloud account.
The dashboard has these widgets:
-
Total/Created Events - total count of findings over time
-
Active Events - total count of Failed events over time.
-
Closed Events - total count of resolved events over time.
-
Top 10 Cloud Accounts - total count of findings by cloud accounts in bar chart.
-
Distribution by Rule Severity - total count of findings by Rule Severity
-
Top 10 Entity Type -top 10 number of findings by entity type
-
Top 10 Entities - top 10 number of findings by entities
-
Top 10 Compliance Framework Rulesets - top 10 compliance frameworks, that generated all findings
-
Top 10 Compliance Rule - top 10 compliance rules, that generated findings
-
Findings by Region - findings generated, per region
Alerts Dashboard
This dashboard is used to add exclusions (on Dome9) for events, and to view details for findings in Dome9.
A Dome9 exclusion prevents similar alerts from being reported (to remove clutter).


