SandBlast Threat Emulation
Description
This widget shows the number of prevented malicious files over the selected report period.
Note - Select the report period in the top left corner of this view. For example, Last 7 Days, This Month, and so on.
Example:

To open the next drill-down level, double-click a headline or matching icon.
Drill-Down View
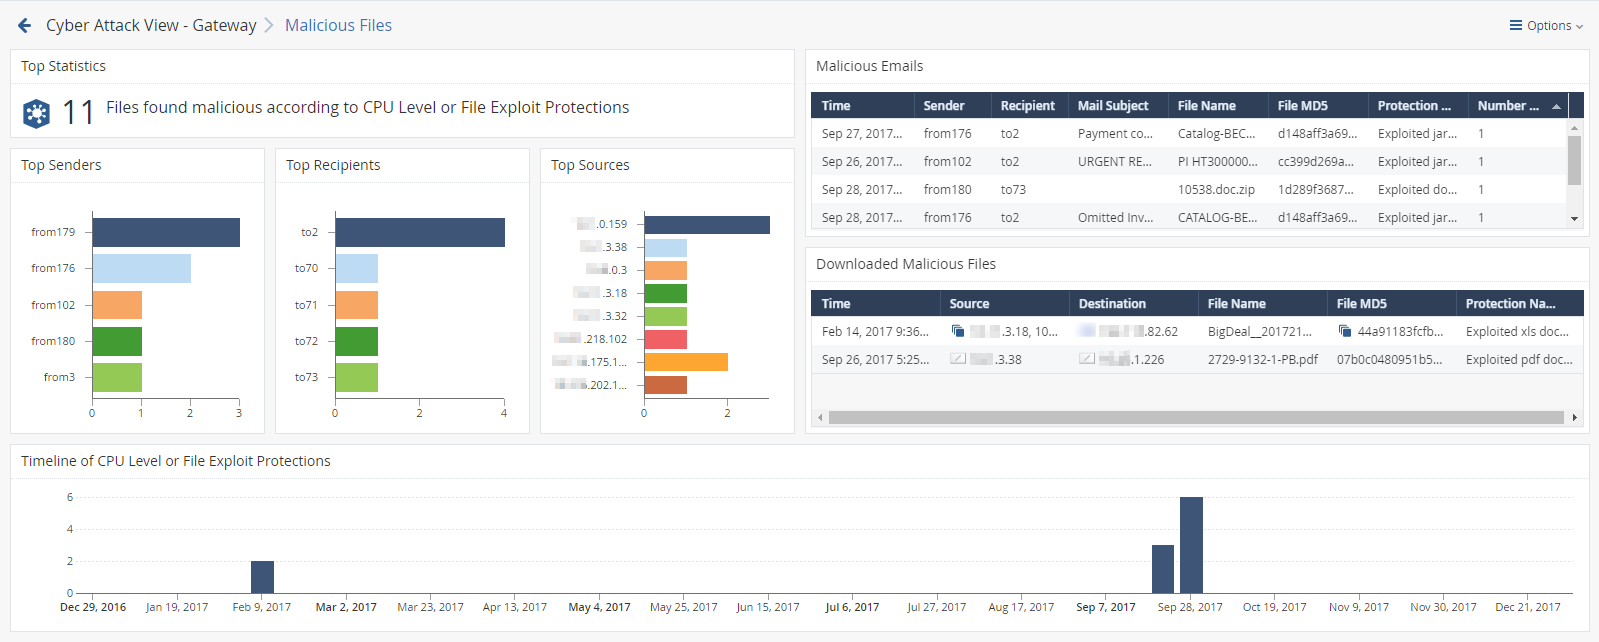
This is an obfuscated example of the drill-down view:
To see the applicable logs (the next drill-down level), double-click a value.
Available Widgets
Widgets available in the drill-down view:
|
Widget |
Type |
Description |
|---|---|---|
|
Top Statistics |
Infographic |
Shows the number of files that were found malicious according to CPU Level or File Exploit protections. |
|
Malicious Emails |
Table |
Shows the malicious emails. Shows:
|
|
Top Senders |
Chart |
Shows the senders of the malicious emails. The chart is sorted by the number of logs. Shows:
|
|
Top Recipients |
Chart |
Shows the recipients of the malicious emails. The chart is sorted by the number of logs. Shows:
|
|
Top Sources |
Chart |
Shows the source hosts of the malicious emails. The chart is sorted by the sources that sent the largest number of malicious emails. Shows:
|
|
Downloaded Malicious Files |
Table |
Shows the information about the detected malicious emails:
|
|
Timeline of CPU Level and File Exploit Protections |
Timeline |
Shows number of protection logs and their timeline. |
Widget Query
In addition to the Default Query, the widget runs this query:
|
|
|
|
|
|