Main Screen - SmartConsole
To open this view:
|
Step |
Description |
|---|---|
|
1 |
Connect with SmartConsole to your Security Management Serveror Domain Management Server. |
|
2 |
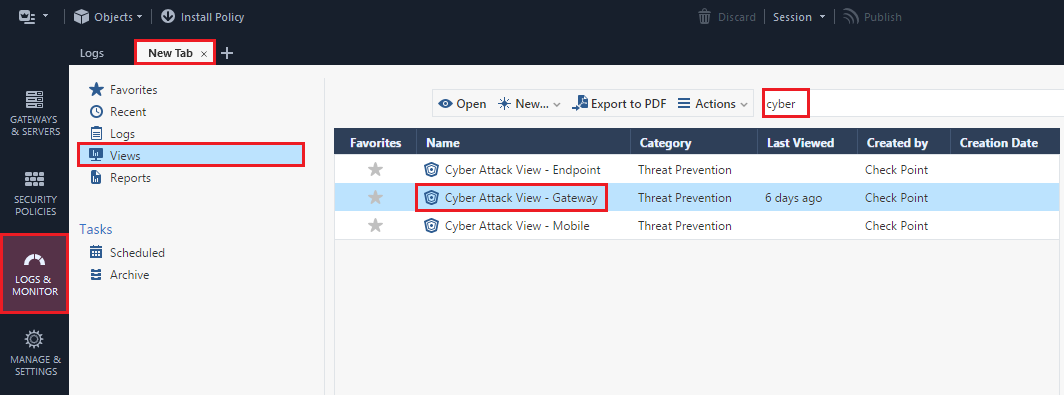
From the left navigation panel, click Logs & Monitor. |
|
3 |
At the top, click the + tab. The New Tab tab opens. |
|
4 |
In the left tree, click Views. |
|
5 |
In the top search field, enter the word cyber. |
|
6 |
The list of the views shows the available Cyber Attack View views. |
|
7 |
Double-click the Cyber Attack View - Gateway (or select it and click Open). |
Example: SmartConsole > New Tab > Logs & Monitor:
Example: Cyber Attack View - Gateway

All the correlated events are tagged with a Severity and Confidence Level of Medium and above (Check Point assigns these tags, and users cannot change them). The queries that run in the background show events with these tags.
All the other events show in the Additional Events section.