Infected Hosts
Description
This widget shows the number of hosts in the network infected with malware over the selected report period.
Note - Select the desired report period in the top left corner of this view. For example, Last 7 Days, This Month, and so on.
The Security Gateway treats a host as infected when it detects an outbound malicious communication or propagation event (lateral movement) from that host.
Anti-Bot and IPS events show this malware communication. The events shown have a Severity and Confidence Level of Medium and above.
Example:
To open the next drill-down level, double-click a headline or matching icon.
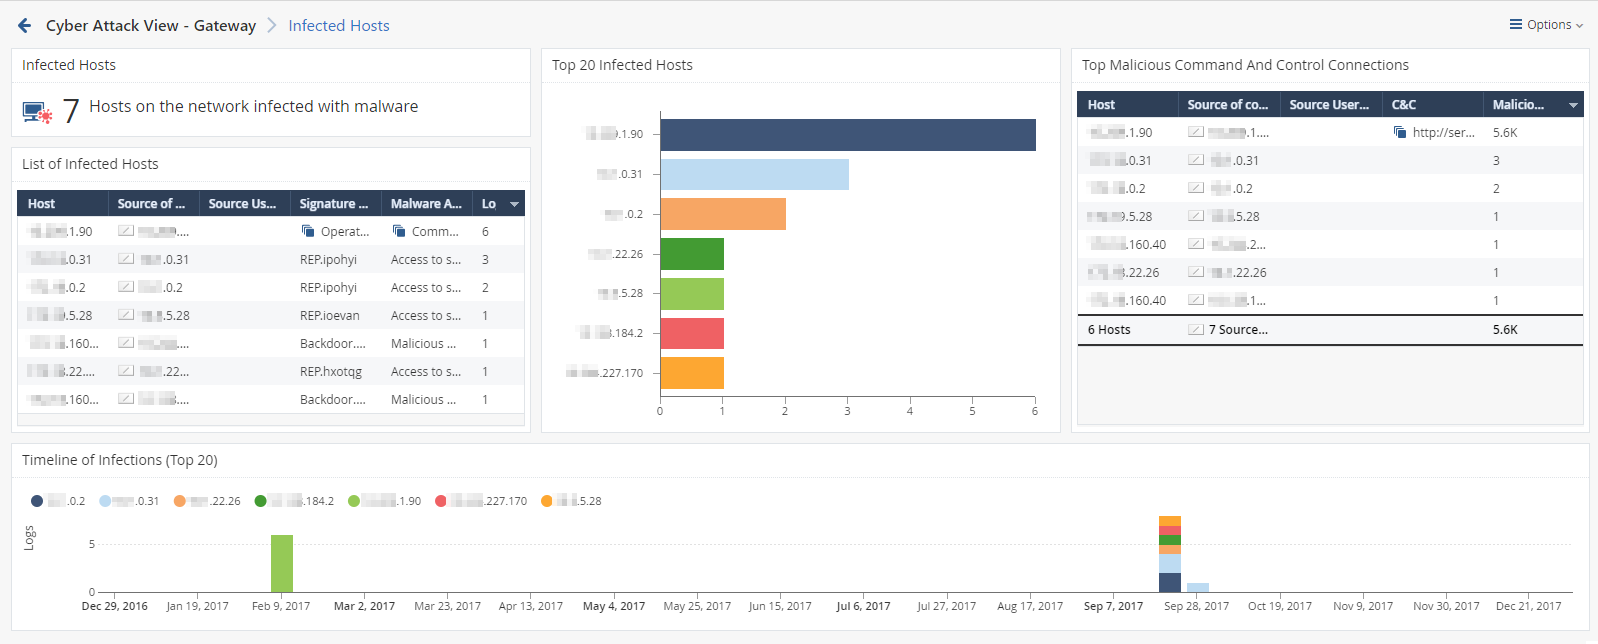
The drill-down view shows summarized data about infected hosts on your internal network.
Drill-Down View
This is an obfuscated example of the drill-down view:
To see the applicable logs (the next drill-down level), double-click on a value.
Available Widgets
Widgets available in the drill-down view:
|
Widget |
Type |
Description |
|---|---|---|
|
Infected Hosts |
Infographic |
Shows the number of hosts on the network infected with malware. |
|
Top 20 Infected Hosts |
Chart |
Shows top hosts (based on the logs count) that connected to Command and Control (C&C) servers. Shows:
Different colors show different infected hosts. |
|
Top Malicious Command And Control Connections |
Table |
Shows top hosts (based on the connection rates) that connected to Command and Control (C&C) servers. Shows:
|
|
List of Infected Hosts |
Table |
Shows the list of infected hosts. Shows:
|
|
Timeline of Infections (Top 20) |
Timeline |
Shows the timeline of malicious connections to Command and Control (C&C) servers across all infected hosts. Shows:
Different colors show different infected hosts. |
Widget Query
In addition to the Default Query, the widget runs this query:
|
|
Best Practices
-
To see which internal hosts initiate the most malicious connections with Command and Control (C&C) servers:
-
Examine the Top Malicious Command And Control Connections.
-
Examine the Threat Prevention logs from the Security Gateway about the internal hosts that initiate the most malicious connections with C&C servers. To do so, double-click the host entry. In the Threat Prevention logs, examine the Suppressed Logs column (see Log Fields).
-
-
For every infected host, query for its IP address to see all threat events related to that host.
This lets you better understand the malicious behavior of the infected host.
 To query an IP address for all related threat events:
-
Right-click an IP address.
-
In the context menu, click Filter: "<IP Address>"
-
At the top, click Cyber Attack View - Gateway.
-
-
If you configured the Anti-Bot Software Blade based on Check Point recommendations, the Security Gateway generates both Detect and Prevent logs.
The Anti-Bot Detect logs do not mean that the Security Gateway allowed malicious connections.
The Anti-Bot can generate the Detect logs, if you enabled the DNS trap feature.
For more information, see:
Infected Hosts video