User Interaction Dashboard
The User Interaction Dashboard provides an overview of the most common day-to-day tasks performed in Avanan:
-
Handling Quarantine Restore Requests
-
Handling Phishing emails reported by end users
For more information on how to handle these tasks, see Phishing Reports Dashboard and Managing Restore Requests.
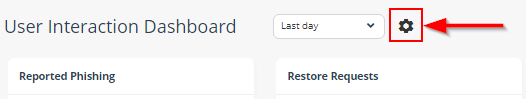
To access the User Interaction Dashboard, go to User Interaction > Dashboard.
The User Interaction Dashboard has these widgets:
|
Widget Name |
Description |
|---|---|
|
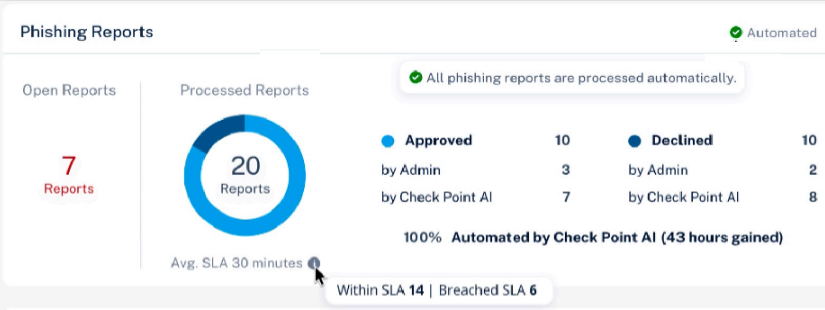
Phishing Reports |
Shows the number of phishing emails reported by end users and the automation level indicator.
|
|
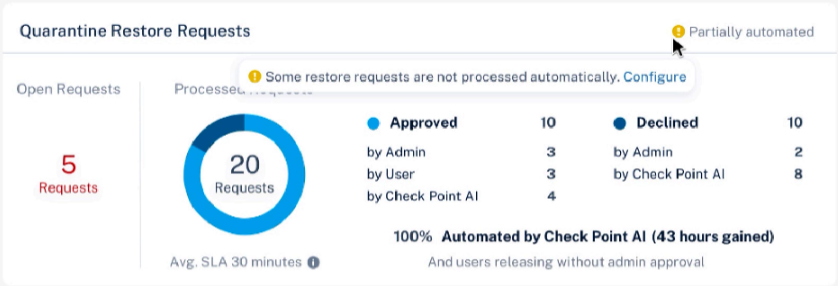
Quarantine Restore Requests |
Shows the number of quarantined restore requests received from the end users and the automation level indicator.
|
|
SLA Trend |
Shows the SLA trend line for the amount of time it took for the help desk to handle requests/reports on a daily basis.
|
|
User Trend |
Shows the trend line of different requests/reports and how they are handled. |
|
User Events |
Shows the list of recent requests reported by the end users. |
|
Top Users |
Shows the list of top requesting/reporting users in your organization. |
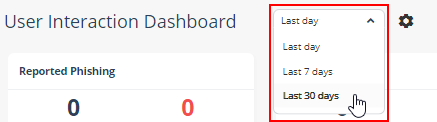
Extending the Time Frame of the Analytics
By default, the User Interaction Dashboard shows analytics for the last day.
To view analytics for extended time periods, select a time frame from the top of the dashboard.